Evolution of plant defense compounds in the plantlitter continuum
The subject of this article brings together two researchers who have a common interest in specialized metabolites involved in plant chemical defenses. Dr. Thomas Michel is analytical chemist at the Institute of Chemistry of Nice (Université Côte d’Azur, Nice, France) where he develops analytical tools for chemical ecology and for discovery of bioactive compounds from plant biodiversity. He employs HPTLC for analytical goals and TLC for preparative separations. Dr. Anne- Violette Lavoir, ecologist at the Institute Sophia Agrobiotech (INRAe, Université Côte d’Azur, Antibes, France) works on the chemical interaction between plants and insects (community ecology, chemical ecology). In this work, the authors employed HPTLC for secondary metabolites screening of different plant extracts in an ecological context.
Introduction
Ecosystems are complex systems, forming a vast network in which different actors – the living beings – interact with each other. The main trophic network is the “green world” [1,2], in which the chlorophyllous plants are the primary producers. They bring organic matter and energy into the network through the fixation of mineral matter by photosynthesis. In this green world, fresh plants are the basis as they are consumed by herbivores, which will in turn be consumed by predators. The “brown world” [1,2] is based on the litter, mostly formed from plant parts (e.g. leaves, bark, stems) that dry out and fall to the ground (inert organic matter). The litter is consumed by detritus feeders (or decomposers), which will then also be consumed by their predators. As litter are previously fresh leaves, the basis of the green and brown world is linked through the so-called plantlitter continuum.
A change in plant or litter chemistry would impact not only their consumers, but all the trophic levels above. For instance, plants could modify their chemical defenses such as secondary metabolites, impacting all their consumers. Because of the plant-litter continuum, any modification in the chemistry of the fresh plants will in turn modify the chemistry of the litter and consequentially the brown trophic network.
In this context, we studied the variation in content of secondary metabolites at five stages of the plant-litter continuum (young plants, mature plants, fresh litter, old litter and decomposer feces), from four plant species (Bromus erectus, Pilosella officinarum, Potentilla grandiflora and Sanguisorba minor). Each stage and plant species were sampled by our collaborators on grasslands of Les Causses (South of France) and each grassland was either fertilized or not. Our main objective was to compare the global chemistry of the four plant species throughout the plant-litter continuum and to see if the fertilization may modify such pattern.
The great diversity of phytochemicals and their small quantities in plant species, and the number of samples to investigate led us to set up a large-scale HPTLC analysis. HPTLC was chosen because it offers numerous advantages such as versatility, capacity to run several samples in parallel and low solvent consumption. Additionally, detection using various derivatization reactions can provide crucial information about the nature of chemical substances present in samples. Furthermore, sample preparation in HPTLC is simple while other chromatographic techniques (e.g. GC and HPLC) usually require a time-consuming and expensive sample preparation prior to the analyses. Therefore, HPTLC is suitable as a high-throughput fingerprinting method in an ecological context.
Standard solutions
Quercetin, asiaticoside and betuline are dissolved in methanol at different concentration levels.
Sample preparation
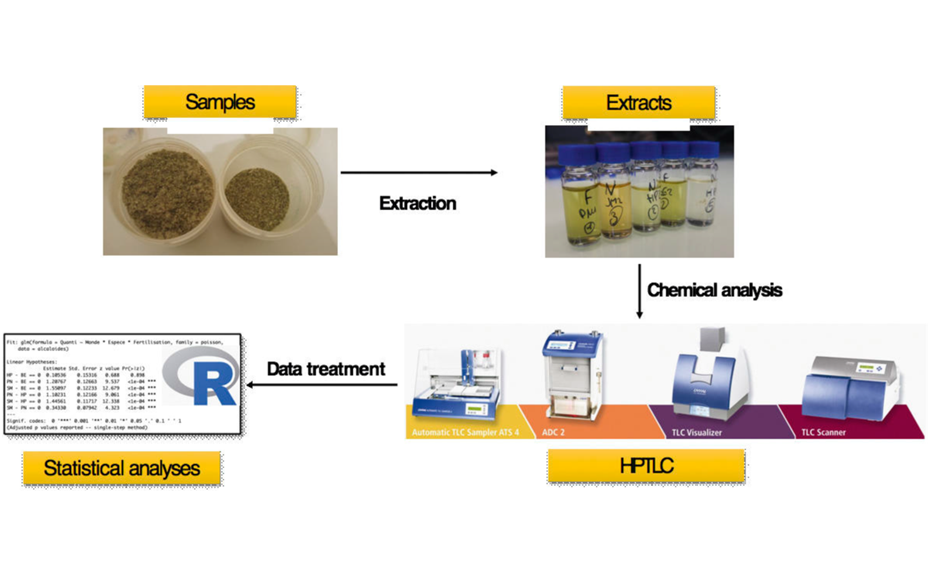
20mg of ground plant are extracted in an ultrasonic bath with 1.6 mL ethanol – water 7:3. Extracts are then filtered and stored at –20 °C before HPTLC analysis.
Chromatogram layer
HPTLC plates silica gel 60 F254 (Merck), 20 x10 cm
Sample application
Automatic TLC Sampler (ATS 4), application as bands, 16 tracks, band length 8.0 mm, distance from left edge 15.0 mm, distance from lower edge 8.0 mm, application volume 2.0 μL for sample solutions and 2.0 μL for standard solutions
Chromatography
In the Automatic Developing Chamber (ADC 2) with ethyl acetate – formic acid – acetic acid – water 100:11:11:26 (polyphenols), chloroform – methanol – water 5:4:1 (glycosylated terpenoids), or hexane – ethyl acetate – water 4:1:0.5 (hydrophobic terpenoids) after chamber saturation (filter paper) and activation at 33% relative humidity for 10 min using a saturated solution of magnesium chloride, migration distance of 70 mm (from the lower edge), drying for 5 min
Post-chromatographic derivatization
All plates are immersed into specific reagents for 2 s using the Chromatogram Immersion Device. For phenolic compounds, the plate is immersed into NP reagent (1.25 g diphenyl borinic acid ethylamino ester in 250 mL of ethyl acetate) and then into PEG reagent (10% polyethylene glycol 400 in dichloromethane). For terpenoids, the plate is immersed into anisaldehyde-sulfuric acid reagent (0.5 mL anisaldehyde, 10 mL glacial acetic acid, 85 mL methanol, 5 mL sulfuric acid) and heated on the TLC Plate Heater at 105 °C for 5 min.
Documentation
TLC Visualizer under UV 254 nm, UV 366 nm, and white light
Densitometry
TLC Scanner 4 and winCATS, slit dimension 5.00 mm x 0.20 mm, scanning speed 50 mm/s, spectra recording from 190 to 450 nm, measurement after derivatization in fluorescence mode at 366/>400 nm with Hg lamp (polyphenols), in absorbance mode at 400 nm (polar terpenoids), and at 600 nm (apolar terpenoids) with tungsten lamp, evaluation via peak area and calibration curves of specific compounds (i.e. quercetin, asiaticoside, betuline)
Statistical analyses
Data are statistically analyzed by a Scheirer-Ray- Hare test using R software.
Results and discussion
To analyze and compare the diversity of the phytochemicals (i.e. polyphenols, terpenes, alkaloids) of the four plant species, the first step was to develop a suitable analytical workflow and to optimize the chromatographic conditions for separation of the different compound families.
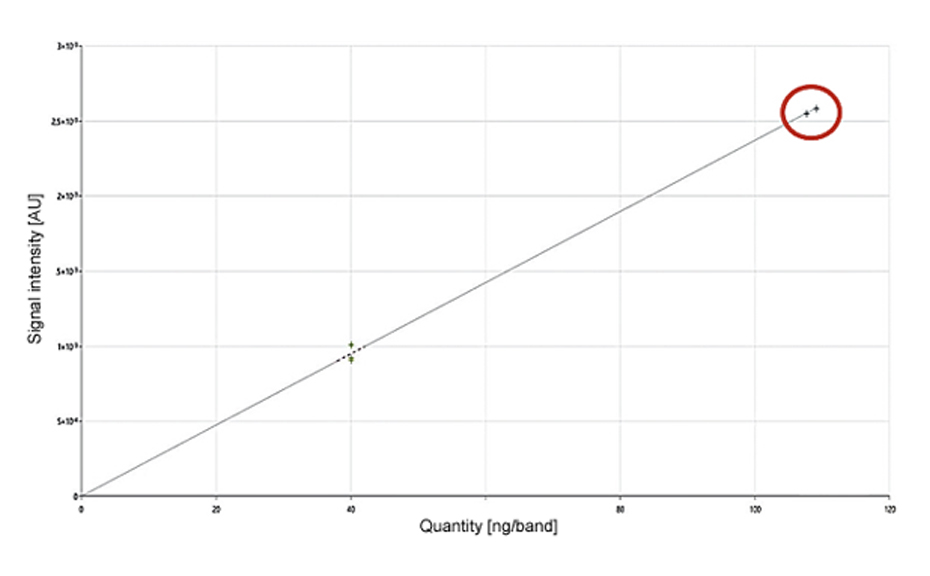
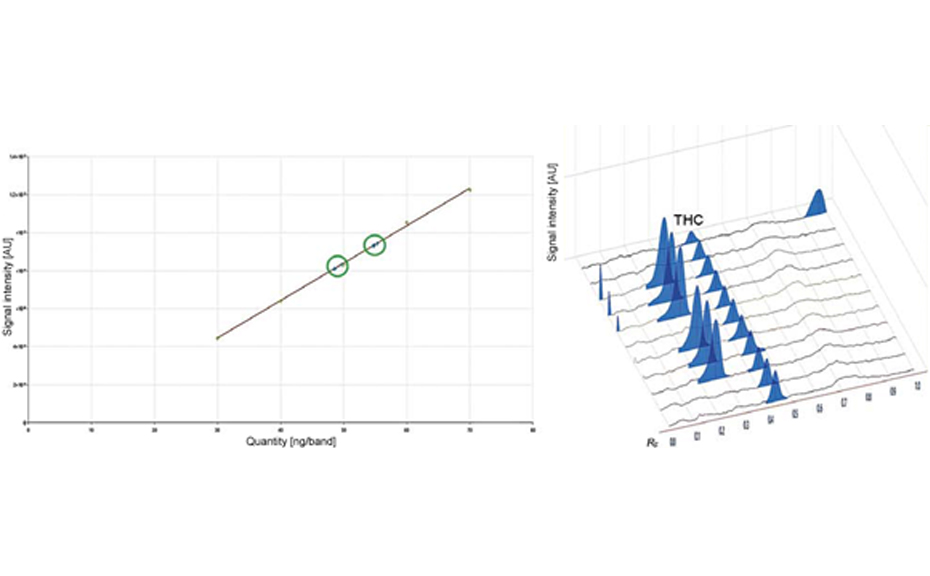
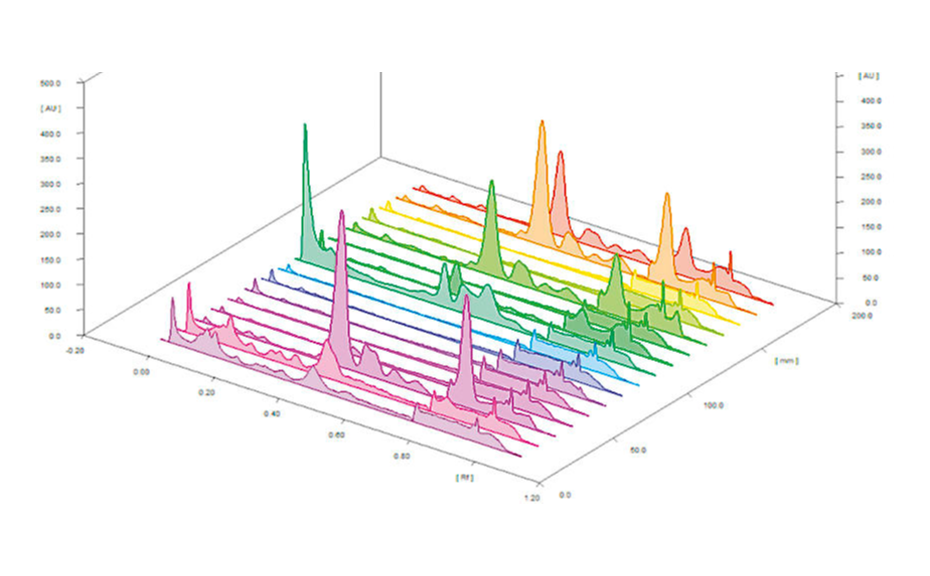
Quantitative estimation of each class of compounds was further performed by scanning densitometry. A typical HPTLC densitogram obtained at 366 nm after derivatization with NP reagent is shown below. The area under each peak was determined and compared to the calibration curves of specific compounds (e.g. quercetin for polyphenols). Results are then expressed in mg standard/g dry matter.
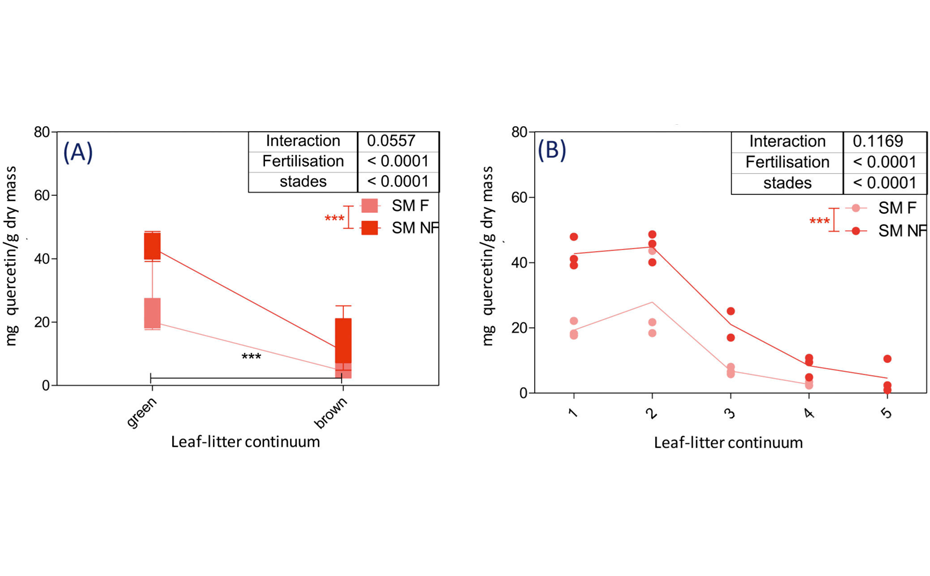
For example, relative quantity of polyphenols (mg of quercetin/g dry mass) in Sanguisorba minor samples significantly decreases between the green and the brown world (p<0.0001). No significant differences were observed between samples from the same world (e.g. young and mature plant). On the contrary, the effect of fertilization is significant for both green and brown worlds (p < 0.0001). Polyphenols are more present in fertilized samples than in unfertilized ones.
Using this HPTLC strategy, we were able to estimate the relative quantity of polyphenols (i.e. mg quercetin/g dry matter) and terpenoids (e.g. mg betulin/g dry matter) according to the plant species, to the stages in the plant-litter continuum and to the fertilization status. Furthermore, this strategy was also applied to tannins, terpenoids, and alkaloids (data not shown), giving us the possibility of a complete screening of secondary metabolites in all plant species studied. The complete results enable the determination of the evolution of secondary metabolites in the fresh plant-decomposed litter continuum:
- There are more secondary metabolites in the green world compared to the brown world (i.e. in fresh and mature plants compared to litter), except for the apolar terpenes that have shown an opposite pattern.
- There are more secondary metabolites in the mature plants compared to the youngest plants inside the green world.
- Plant species show diverse metabolic strategies: Bromus erectus has significantly less secondary metabolites compared to other species.
- The concentration of secondarymetabolites in plants of the same species is higher on the non-fertilized site.
To conclude, this HPTLC strategy allowed us to highlight modifications of the plant secondary metabolites throughout the plant-litter food web but also to observe a link between the green and the brown world. Interestingly, even though plants show various strategies, we always observe a decrease of concentrations in the brown world. As secondary metabolites are mainly defense compounds, we hypothesize a decrease of such compounds in the leaf before they fall in order to recycle such compounds and/or to avoid a negative impact on detritus feeders which are consuming the litter. Analyzing the plant chemistry throughout the plant-litter continuum helps us to disentangle the complexity and the link structuring the green and brown worlds.
-
01
Analytical workflow used to extract, separate and quantify secondary metabolites of different plant species
-
 02
02
Typical HPTLC densitogram of samples obtained at 366/>400 nm after derivatization with NP reagent
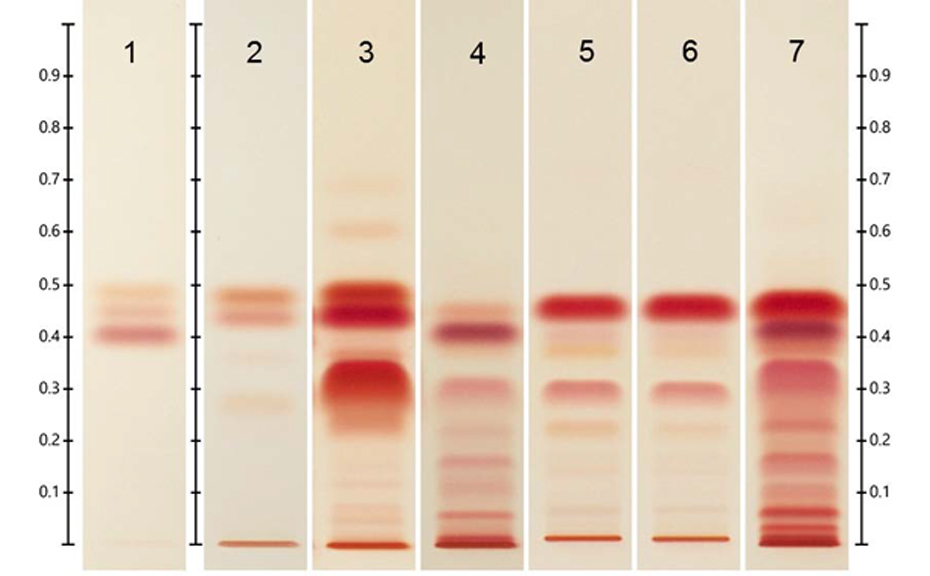
03
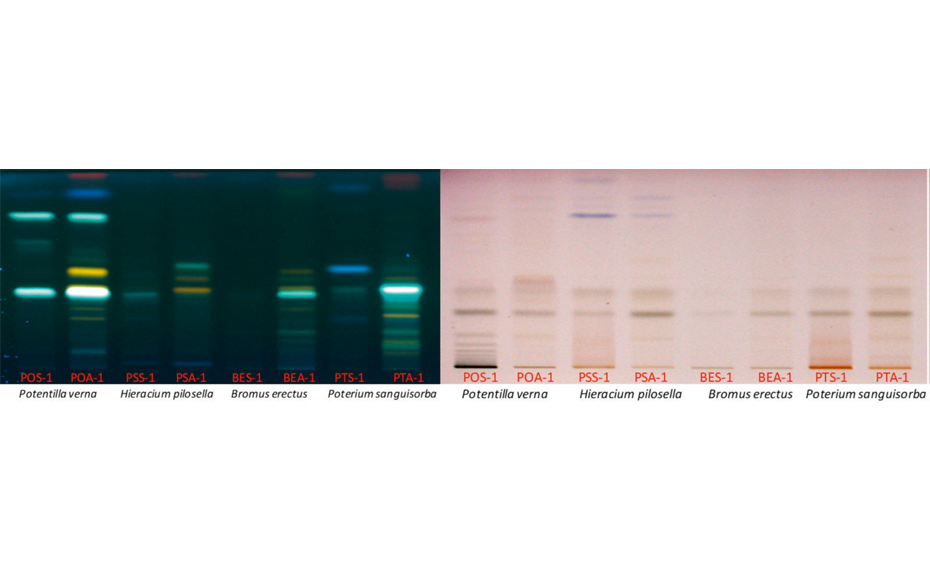
Typical HPTLC fingerprints of the four analyzed plant species (above- and belowground samples) under UV 366 nm after derivatization with NP/PEG reagent and under white light after derivatization with anisaldehydesulfuric acid reagent (POS-1 = Potentilla grandiflora below, POA-1 Potentilla grandiflora above, PSS-1 = Pilosella officinarum below, PSA-1 = Pilosella officinarum above, BES-1 = Bromus erectus below, BEA-1 = Bromus erectus above, PTS-1: Sanguisorba minor below, PTA-1: Sanguisorba minor above)
04
Relative quantity of polyphenols in mg of quercetin/g dry mass in the leaflitter continuum of Sanguisorba minor. 1-young plant; 2-mature plant; 3-fresh litter; 4-decomposed litter; 5-faeces; green world gathers stages 1 and 2, brown world gathers stages 3 and 4; F: fertilized; NF: non-fertilized
Literature
[1] Wardle et al. Science (2004), 304, 1629
[2] Wolkovich et al. Ecology (2014), 95–12
Contact: Dr. Thomas Michel, Université Côte d’Azur, CNRS, Institut de Chimie de Nice UMR 7272, 06108 Nice, France, thomas.michel[at]univ-cotedazur.fr
Acknowledgement: The authors acknowledge all the partners involved in the EC2CO COMODO project funded by CNRS (supervision: S. Coq), especially Florian Goettelmann and Louisa Saghir for their respective works.