HPTLC Fingerprint of Ginkgo biloba flavonoids
This case study method demonstrates how Ginkgo biloba extracts can be rapidly identified by HPTLC based on their flavonoid fingerprint.
Introduction
In recent years, the need for quality assurance tools to ensure the identity, purity, and quality of botanical material has risen dramatically. HPTLC has emerged as a versatile, high throughput, and cost-effective technology, that is uniquely suited to meet these requirements. According to the regulation of e.g. United States Pharmacopeia (USP 37, Monograph), Ginkgo leaf and Ginkgo extracts are identified by HPTLC. Our case study method demonstrates how Ginkgo biloba extracts can be rapidly identified by HPTLC based on their flavonoid fingerprint.
Challenge
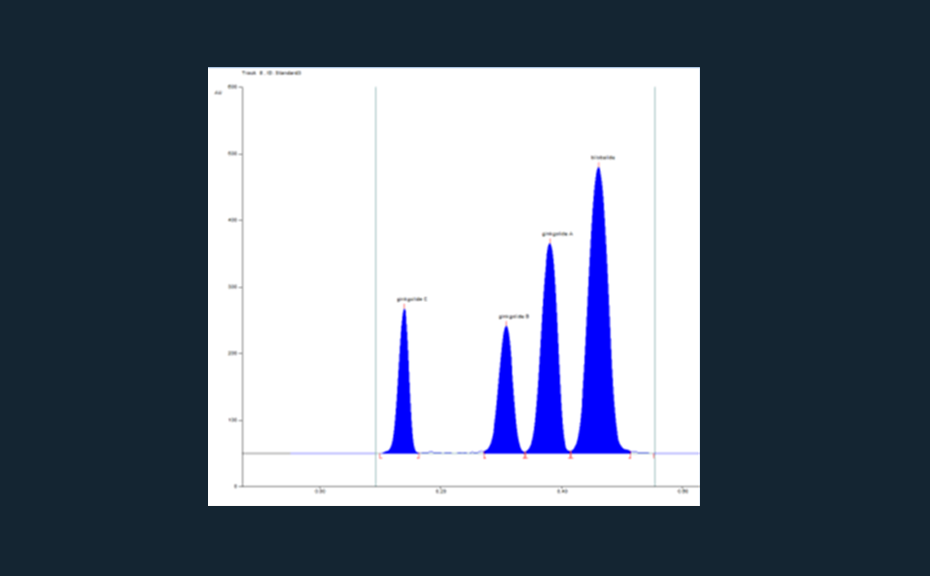
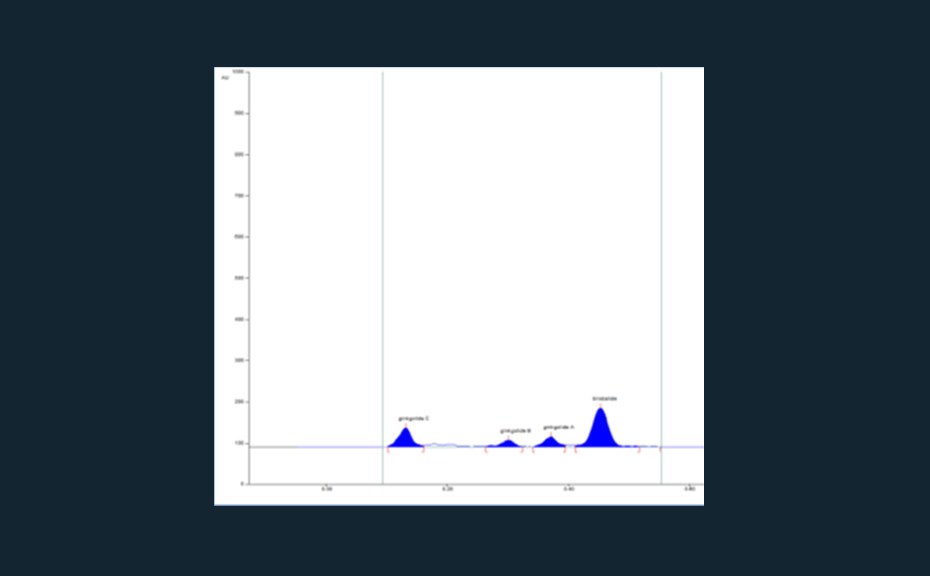
Most separation techniques do not allow parallel analysis of numerous samples at the same time and they often face problems in separating complex mixtures of substances. However, visual evaluation of HPTLC plates allows for convenient comparison of many samples side by side, where similarities and differences can clearly be seen. Quantification of the separated compounds is possible by densitometry using our TLC Scanner 4.
Description of the procedure documentation
Ginkgo leaves, Ginkgo extracts and the standards are prepared according to CAMAG’s standardized method (F-16B.1). All parameters (conditions for sample application,chromatogram development, evaluation) are logged into the vision CATS software which controls all major CAMAG instruments needed for the HPTLC analysis. The samples and standards are applied bandwise on a HPTLC plate using the ATS 4 which guarantees for precise and reliable application. Then the HPTLC plate is developed under standardized conditions in a saturated chamber using the ADC 2. The ADC 2 is unsurpassed for reproducibility and universal applicability in HPTLC. The developed HPTLC plate is evaluated and documented by the TLC Visualizer in three modes, white light, UV 254 nm and UV 366 nm. By the use of HPTLC plates containing a fluorescence indicator, all analytes which absorb UV 254 nm can be detected prior to derivatization. Derivatization increases the specificity and selectivity of the method. For the analysis of flavonoids the plate is dipped in “Natural Products” reagent and a solution of PEG 400 and evaluated by the TLC Visualizer under UV 366 nm.
-
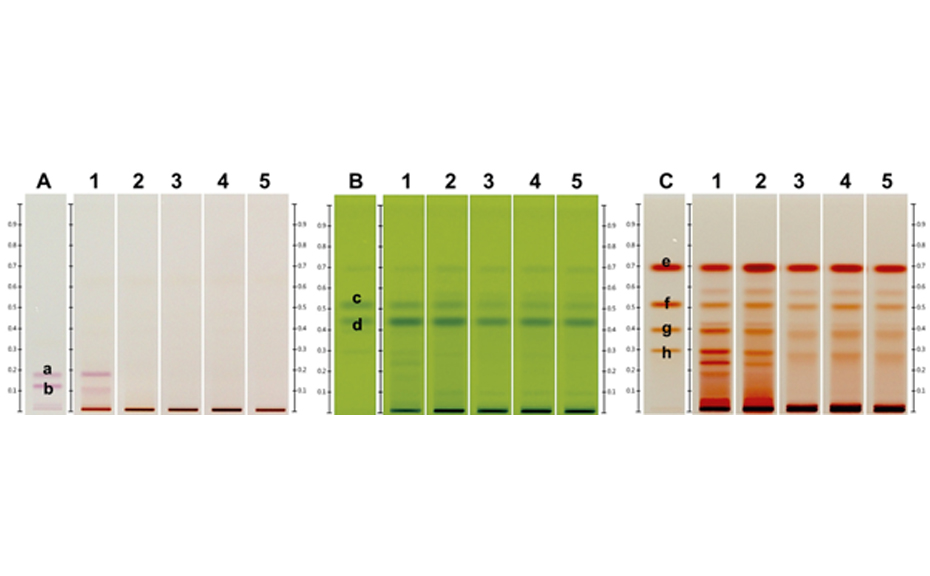
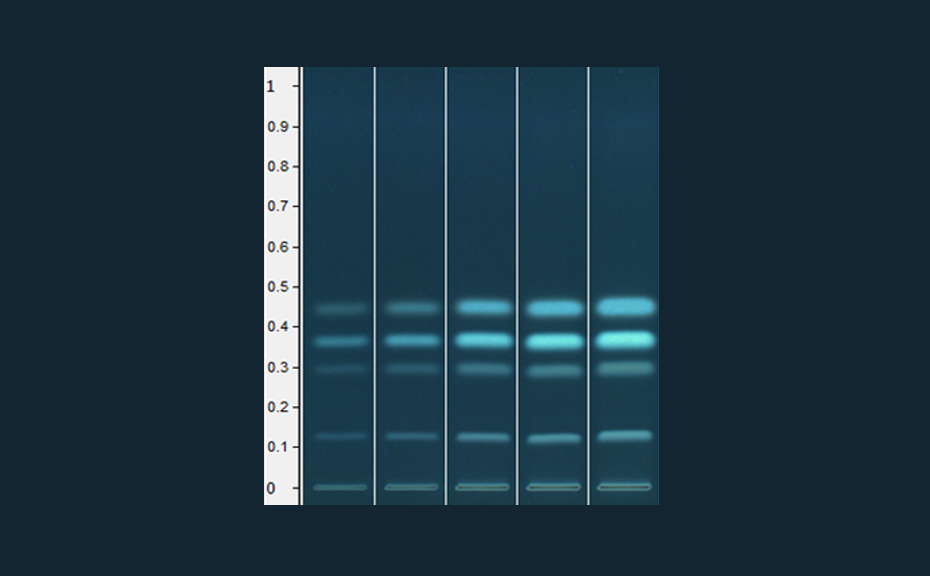
01
Images of two HPTLC plates with separated Ginkgo flavonoids (images generated using the TLC Visualizer and UV 366 nm). The conditions during all HPTLC steps were identical and show the same results.
-

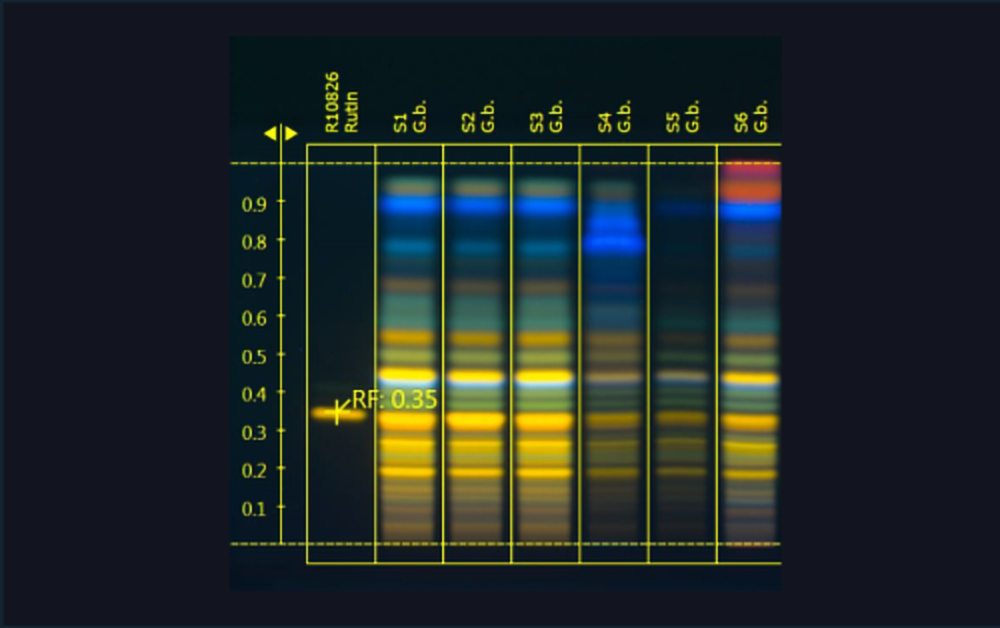
02
Images of two HPTLC plates with separated Ginkgo flavonoids (images generated using the TLC Visualizer and UV 366 nm). The conditions during all HPTLC steps were identical and show the same results.
| 1 | Rutin (Standard) |
| 2 | Ginkgo leaf extract (*BRM) |
| 3 | Ginkgo leaf extract |
| 4 | Ginkgo leaf extract |
| 5 | Ginkgo leaf extract mixed with green tea (additional blue bands in the upper zone of the chromatogram) |
| 6 | Ginkgo leaf extract mixed with cellulose (less intensity of all flavonoids) |
| 7 | Ginkgo leaf (additional bands due to extracted chlorophylls) |
Benefits of using modern HPTLC for the analysis of herbal medicines and botanical dietary supplements
- Several samples can be visually analyzed in parallel. The TLC Visualizer in combination with the visionCATS software features easy comparison and rearrangement of HPTLC fingerprints of samples from the same as well as from different plates. This helps to assess differences in the fingerprint patterns of different samples and over time which is useful for long-term and stability studies of raw materials and finished products. Furthermore adulterated samples are reliably identified.
- The quality of raw materials is rapidly and easily determined by HPTLC. For the identification of herbal drugs and other naturally derived materials standardized HPTLC is the method of choice and recommended by pharmacopoeias worldwide.
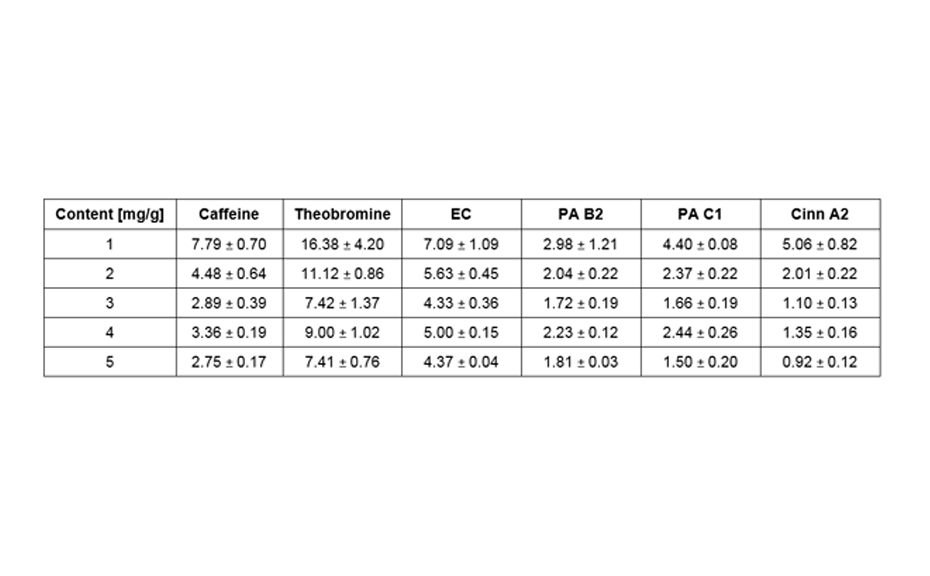
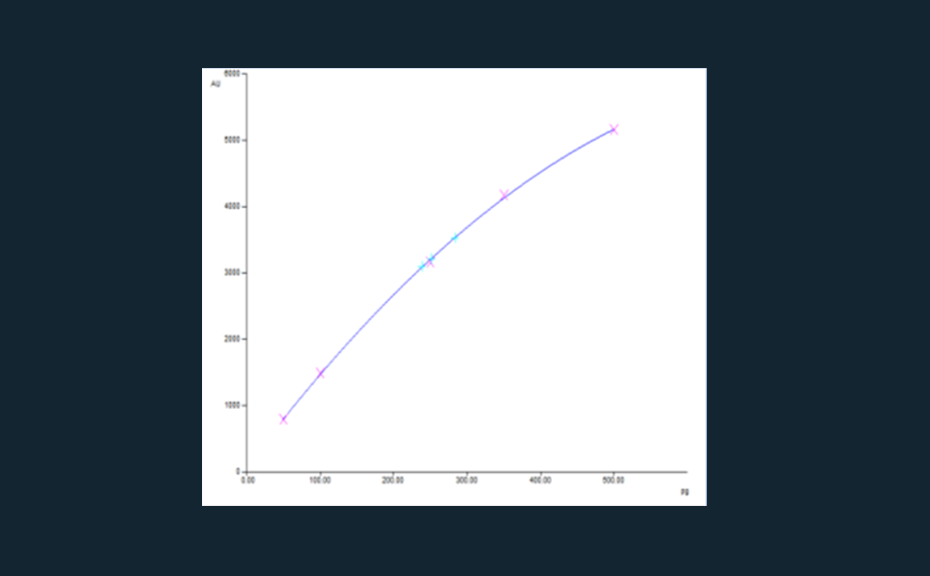
- In this case study the identity of different Ginkgo biloba samples were either confirmed, or not, by comparison of their HPTLC fingerprint with those of a “Botanical Reference Material” (BRM) of Ginkgo biloba. With chemical reference standards and measurement by the TLC Scanner cut-off values can be established for limit tests and quantification of single marker compound is possible.


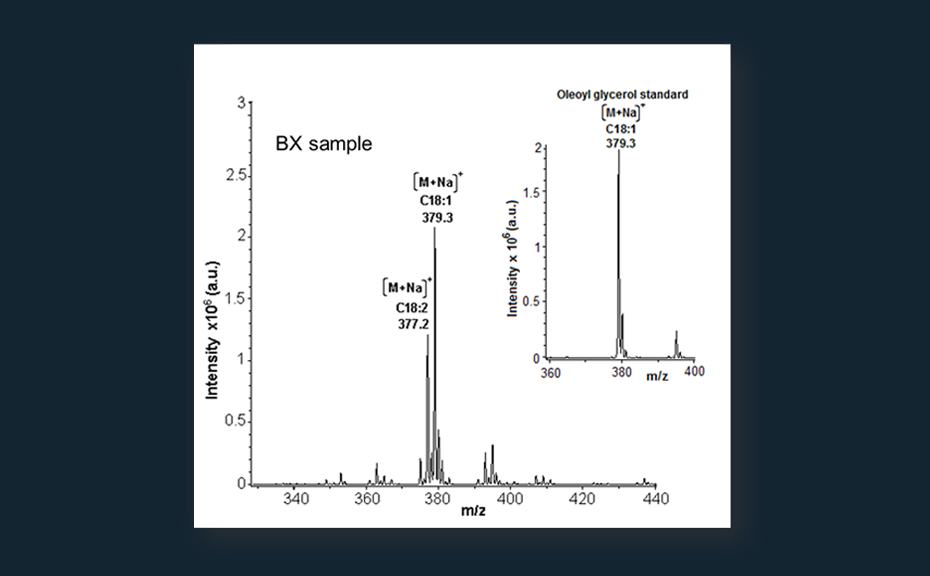

![HPTLC-MS full scan mass spectrum of eluted estrogen active zone with the expected mass m/z 339 [M-H]-](/wp-content/uploads/2024/07/cs_estrogens_img_2.png)