Sensitive detection of estrogenic compounds in surface water
The Biochemistry & Ecotoxicology Department of the Federal Institute of Hydrology (BfG), Germany, is engaged in the development, validation, and standardization of biological methods and bioanalytical instruments to support their implementation in water regulation. In this context, the group organized an interlaboratory validation study of a bioautographic method for the detection of hormonally active substances in environmental samples.
The following laboratories contributed to the study:
- Bayerisches Landesamt für Umwelt (Germany),
- Bundesanstalt für Gewässerkunde (Germany),
- Societé des Produits Nestlé (Switzerland),
- Schweizerisches Zentrum für angewandte Ökotoxikologie (Switzerland),
- Zweckverband Landeswasserversorgung Wasserwerk Langenau (Germany).
Introduction
As recently reported, several studies have demonstrated the impact of estrogenic compounds on fish populations at concentrations in the ng/L range [1,2]. As a result, the estrogenic compounds estrone (E1), 17β-estradiol (E2) and the synthetic contraceptive 17α-ethinylestradiol (EE2) have been included in Annex X of the European Water Framework Directive (EU-WFD) as priority compounds. Despite the development of MS-based methods, the sensitive detection of EE2 remains challenging, particularly due to its proposed environmental quality standard (EQS) of 17 pg/L [3]. In addition, other compounds contributing to the additive estrogenic effects, which are not included in Annex X, remain undetected when monitoring relies solely on targeted chemical analysis.
To address the need for a sensitive method capable of detecting a broad spectrum of estrogenic compounds, the planar yeast estrogenicity screen (p-YES), which combines HPTLC with a yeast-based reporter gene assay, represents a highly promising approach [4]. This methodology enables, for example, the detection of EE2 and E2 at levels as low as 5 pg/L in 1000-fold enriched water samples, while simultaneously indicating the presence of other estrogenic compounds. Their activity can be expressed as a Biological Equivalence Concentration (BEC). This approach paves the way for both compound-specific and effect-based detection of estrogenic substances, thereby supporting more comprehensive monitoring strategies in line with the EU-WFD. The results of the first interlaboratory trial for the sensitive detection of EE2, based on a technical specification developed within the framework of the DIN working group NA 119-09-05-13 AK, are presented.
Standard solutions
Estrogenic standards are dissolved in methanol and diluted to final concentrations in a reference mix containing: E1 = 40 pg/µL, EE2 = 4 pg/µL, E2 = 4 pg/µL, and Estriol (E3) = 400 pg/µL. Further dilutions are prepared from this mixture, and amounts ranging from 0.1 to 10 pg of E2 and EE2 are applied in 5 µL volumes. The amounts of E1 are 10-fold higher, and those of E3 are 100-fold higher, to compensate for their lower estrogenic activity.
Sample preparation
Surface water samples were enriched using HLB cartridges, which were previously conditioned three times with 2 mL of methanol and four times with 2 mL of ultrapure water (deionized).
A volume of 1000 mL of sample was passed dropwise through the cartridge using a vacuum manifold. The cartridges were then dried under vacuum with air for 40 min.
The loaded HLB cartridges were eluted four times with 2 mL of methanol, and the combined eluates were adjusted to a final volume of 1 mL.
For the interlaboratory trial, water from the Rhine River was used. An aliquot of the river water was spiked with 5 pg/L of EE2 to validate its quantification using the p-YES assay; while enriched ultrapure water was used as a blank.
Chromatogram layer
HPTLC plates silica gel 60 F254 (Merck) 20 × 10 cm.
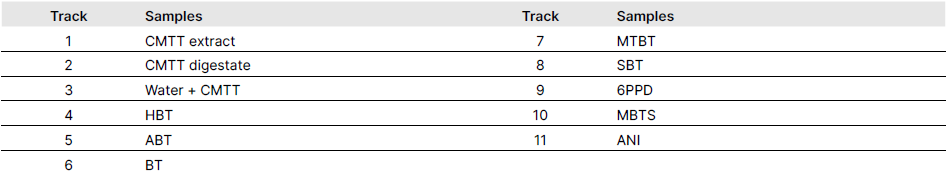
Sample application
Samples are applied as bands with a length of 6 mm or as area measuring 6 × 3 mm, with the first application position at X = 15 mm, and Y = 10 mm. The distance between track boundaries is not less than 5 mm.
Typical application volumes for samples range from 5 to 50 µL, while standards are applied in a volume of 5 µL. For a sensitive detection of low EE2 levels, 50 µL of the sample are applied to a 6 × 3 mm area.
Chromatography
Plates are developed using the AMD 2 according to the following protocol: Focusing with 100% methanol up to 20 mm, 2 min drying, e.g., with a cold air stream, followed by a development using chloroform, cyclohexane, ethyl acetate 55:25:20 (V/V), up to 80 mm, followed by 7 min drying.
Post-chromatographic derivatization
A genetically modified yeast strain (Saccharomyces cerevisiae BJ3505) was used as the test strain [5]. After complete evaporation of the mobile phase using a cold air stream, 3 mL of a yeast cell suspension in exposure medium (yeast nitrogen base, 27.9 mg/L; glucose, 129 mg/L; L-lysine, 146 µg/L; L-histidine, 100 µg/L; CuSO4•5H2O, 25 µg/L) with a cell density of 8 × 10⁷ ± 10% cells/mL (FAU = 1500 ± 150) was applied to the surface of the HPTLC plate using the Derivatizer equipped with the yellow nozzle at spraying level 5.
The plates were incubated in a plastic bowl at 30°C for 3 h in a humid atmosphere within a temperature-controlled incubator (30°C ± 2 °C, ≥ 90% rH). The plates were then dried using non-heated air from a hair dryer for about 3 to 5 minutes (dried plate).
Subsequently, 2.1 ± 0.2 mL of the lacZ reaction mixture (Na2HPO4•2H2O, 10.67 g/L; KCl, 0.75 g/L; MgSO4•7H2O, 0.25 g/L; sodium dodecyl sulfate, 1 g/L; 4-methylumbelliferyl β-D-galactopyranoside (MUG), 0.5 g/L; pH 7.0 ± 0.2) was sprayed onto the plate using the Derivatizer equipped with the yellow nozzle at spraying level 5.
The plates were incubated in a plastic bowl without a lid in an incubator at 37°C for 15-30 min.
Documentation
Bioautograms of the developed plates were recorded using the TLC Visualizer 2 at 254 nm and 366 nm. After derivatization with the enzyme substrate MUG, an additional bioautogram of the plate was recorded at 366 nm.
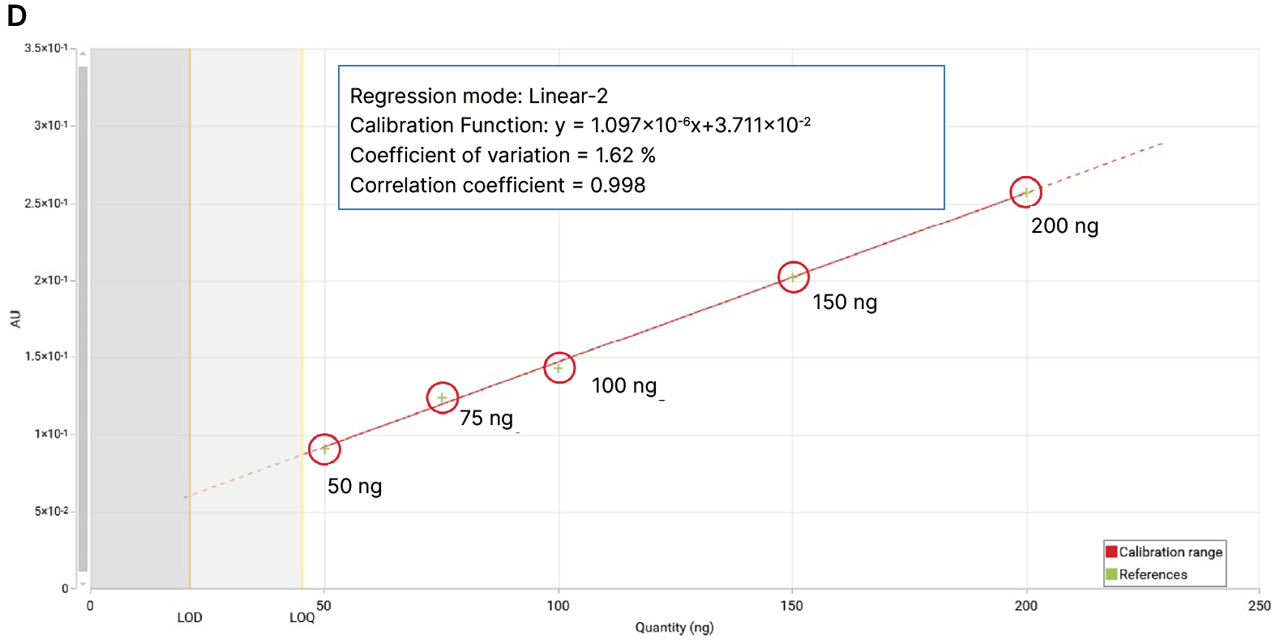
Data analysis for the quantification of estrogenic effects was based on peak integrals. These were derived from the green channel of the fluorescence bioautogram using image analysis software. In accordance with ISO 23196, a five-parameter logistic function was used to fit the calibration curves of the standard compounds.
Results and discussion
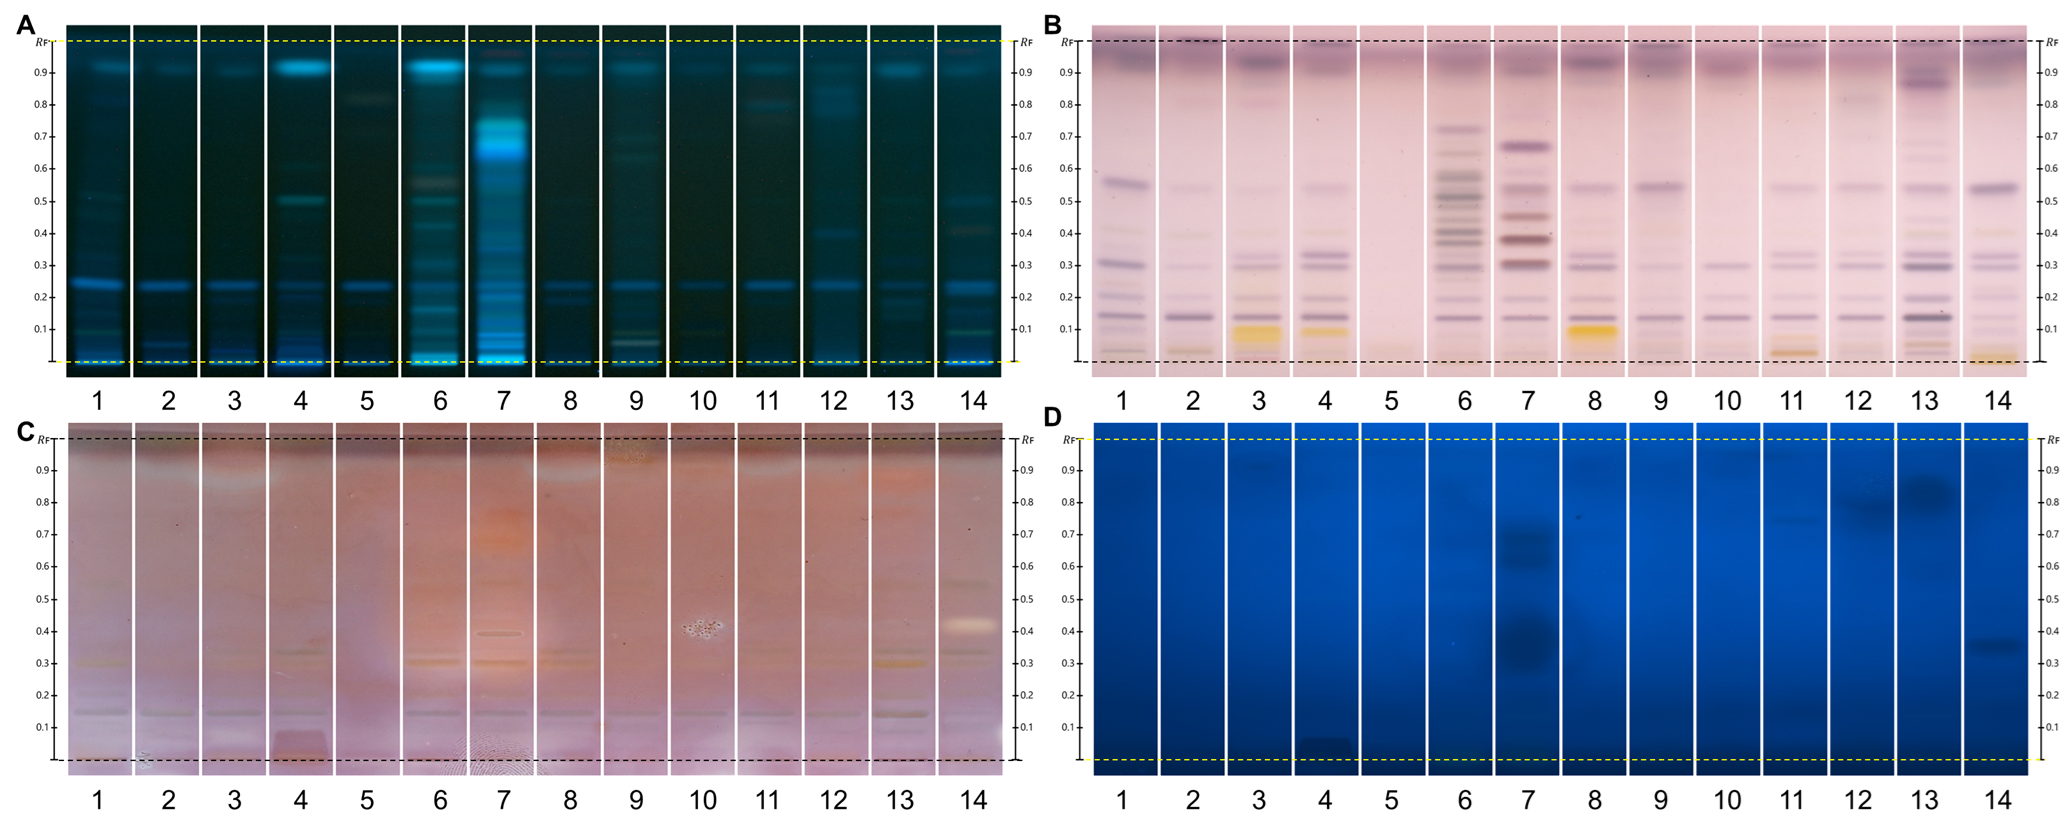
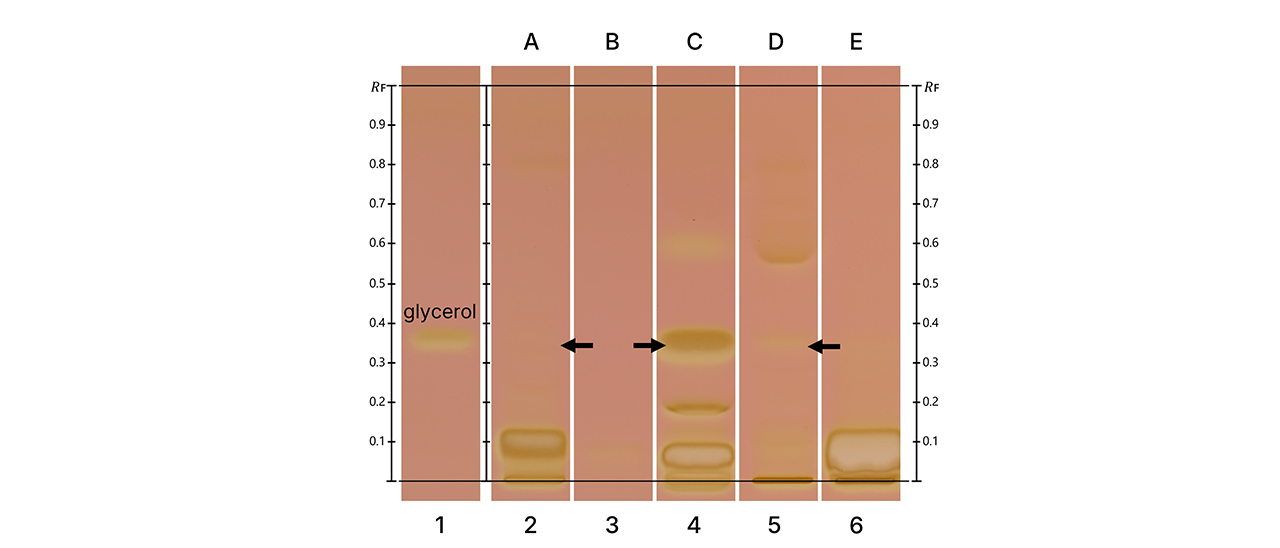
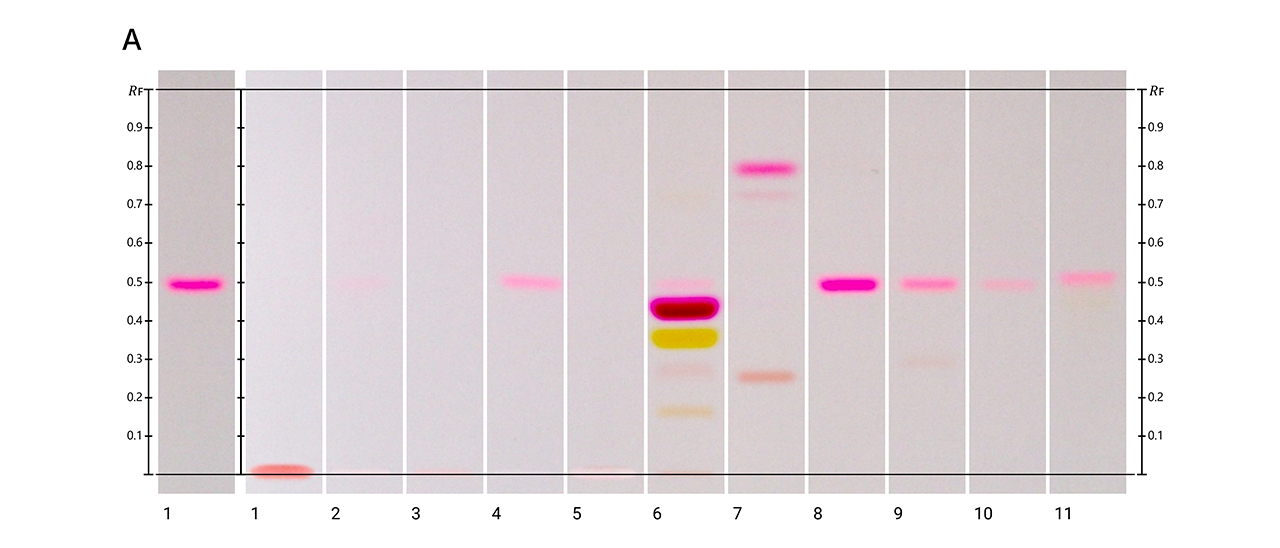
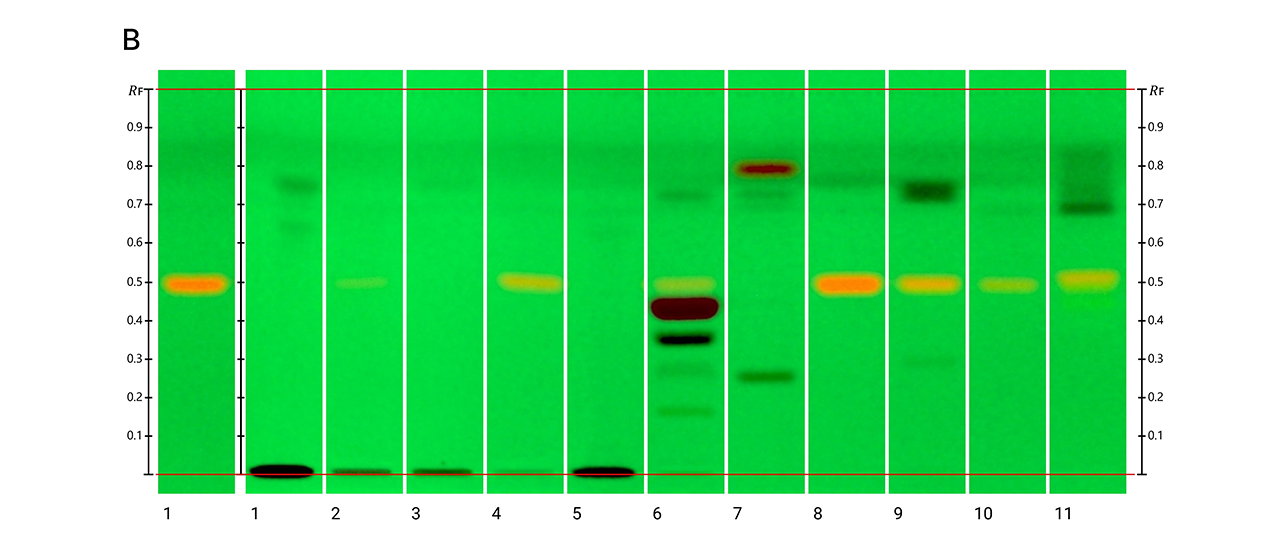
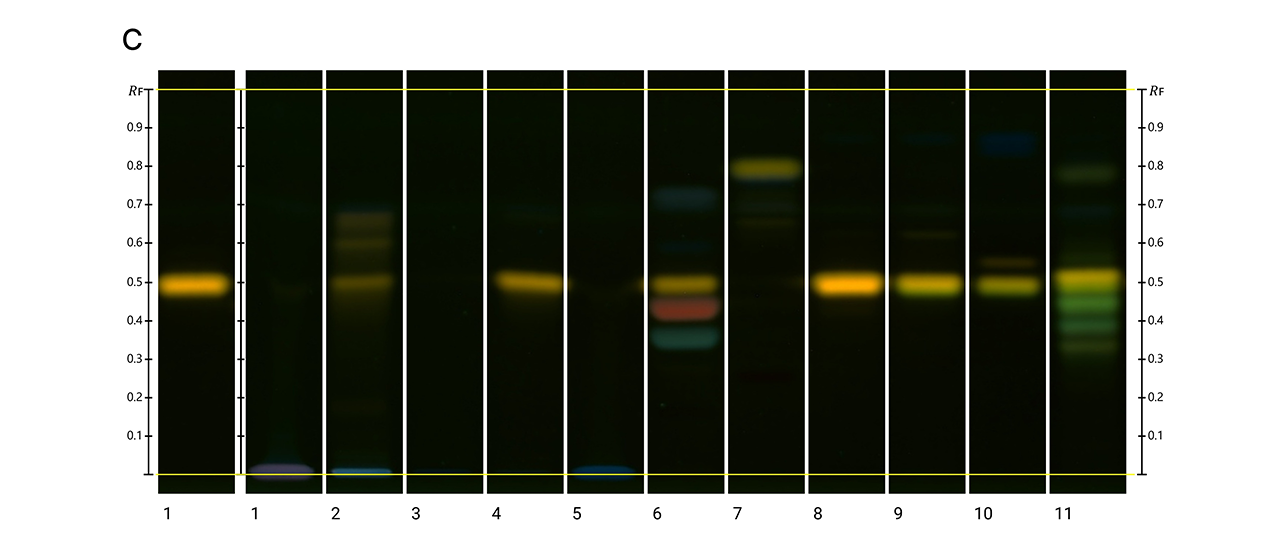
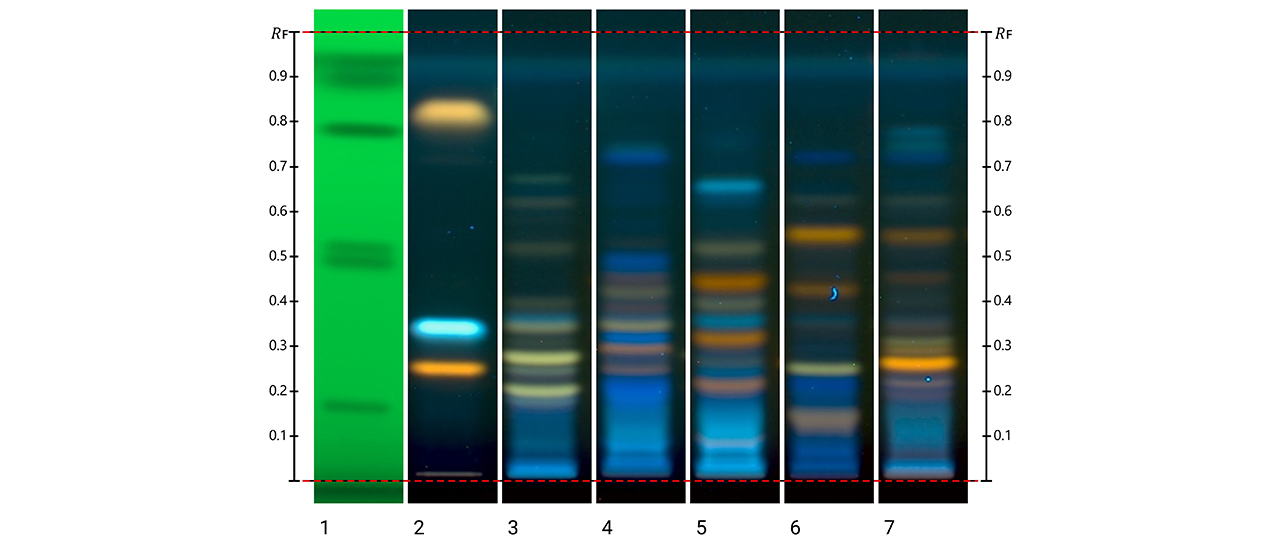
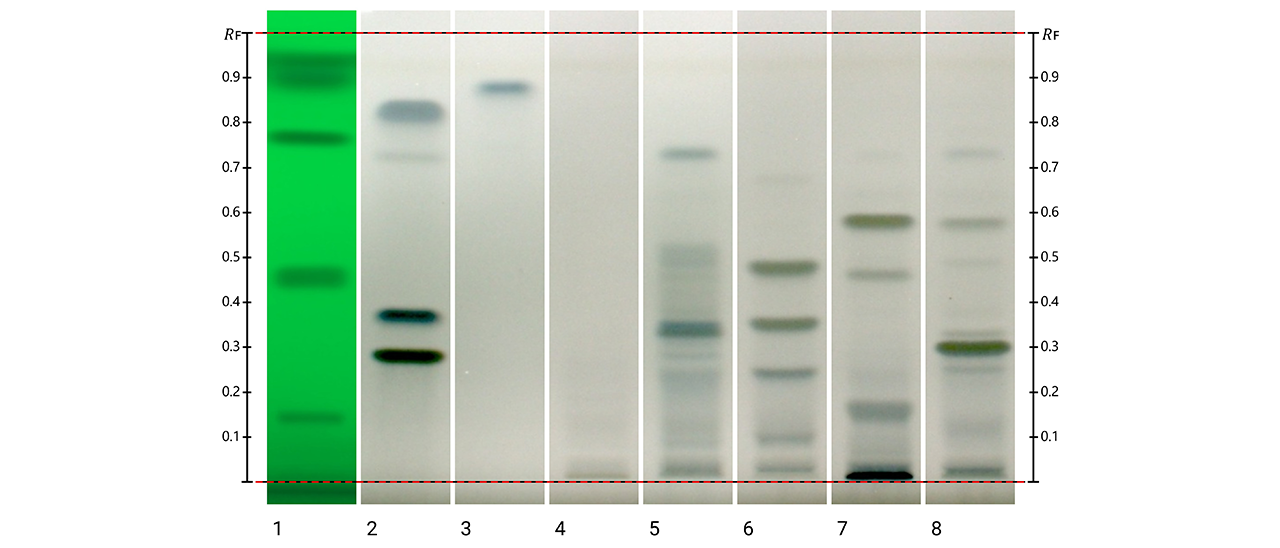
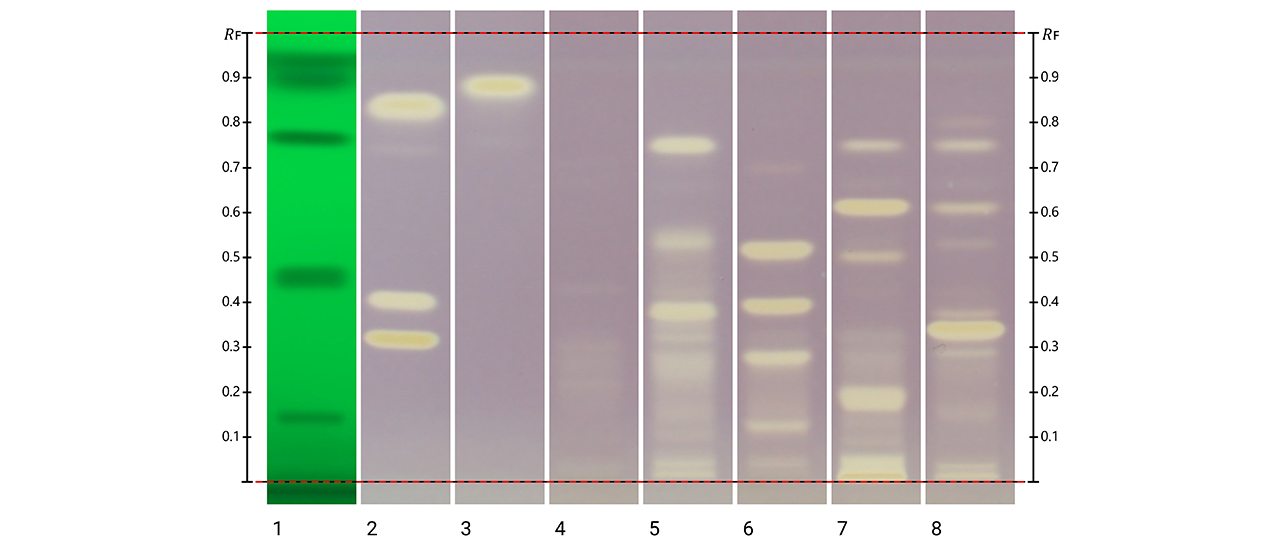
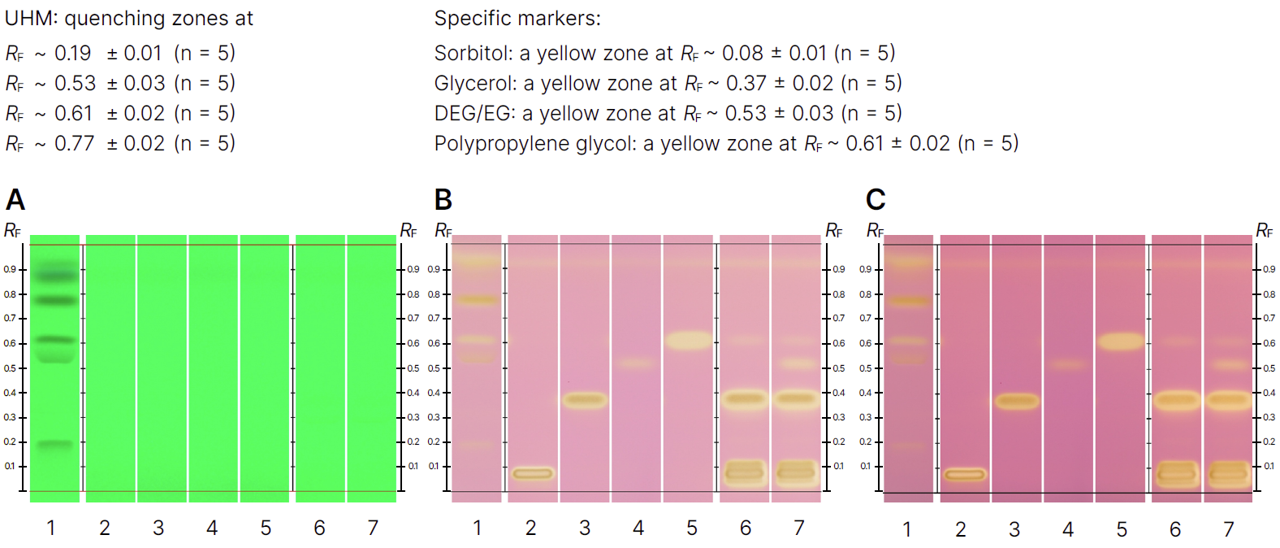
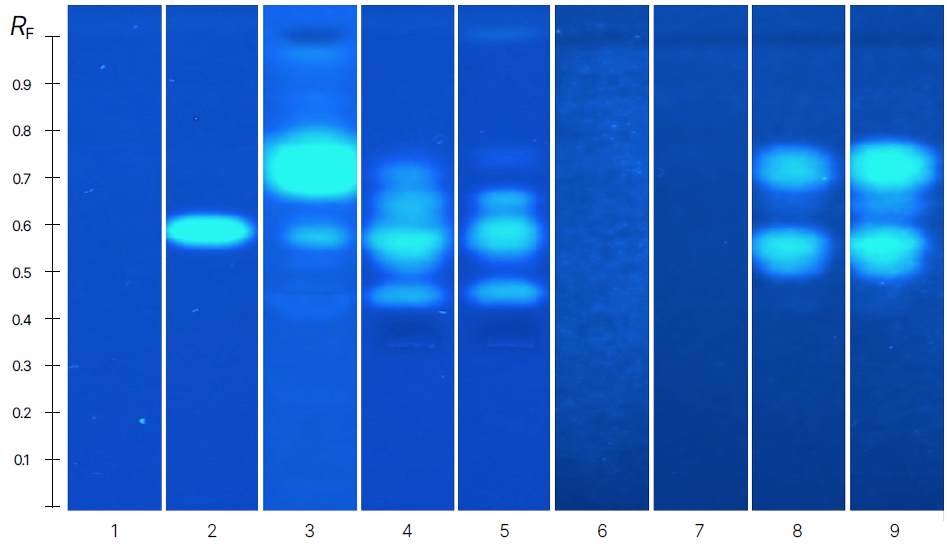
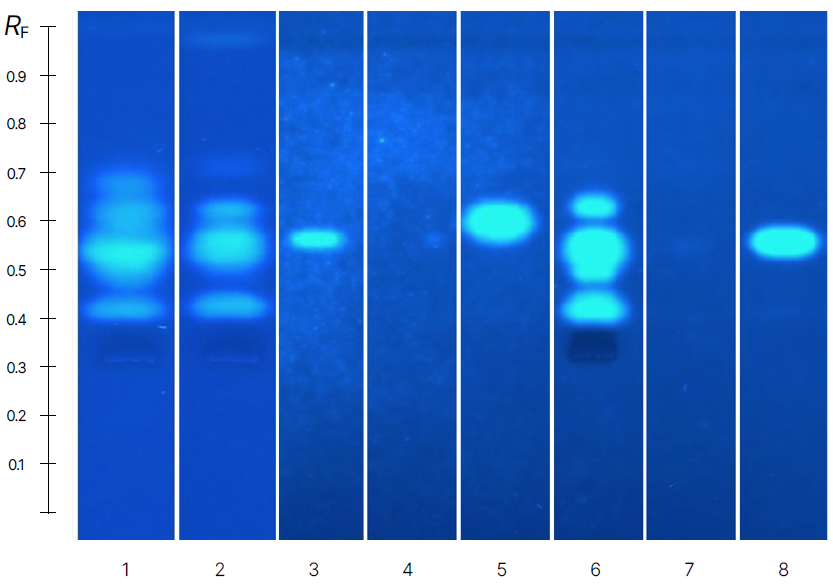
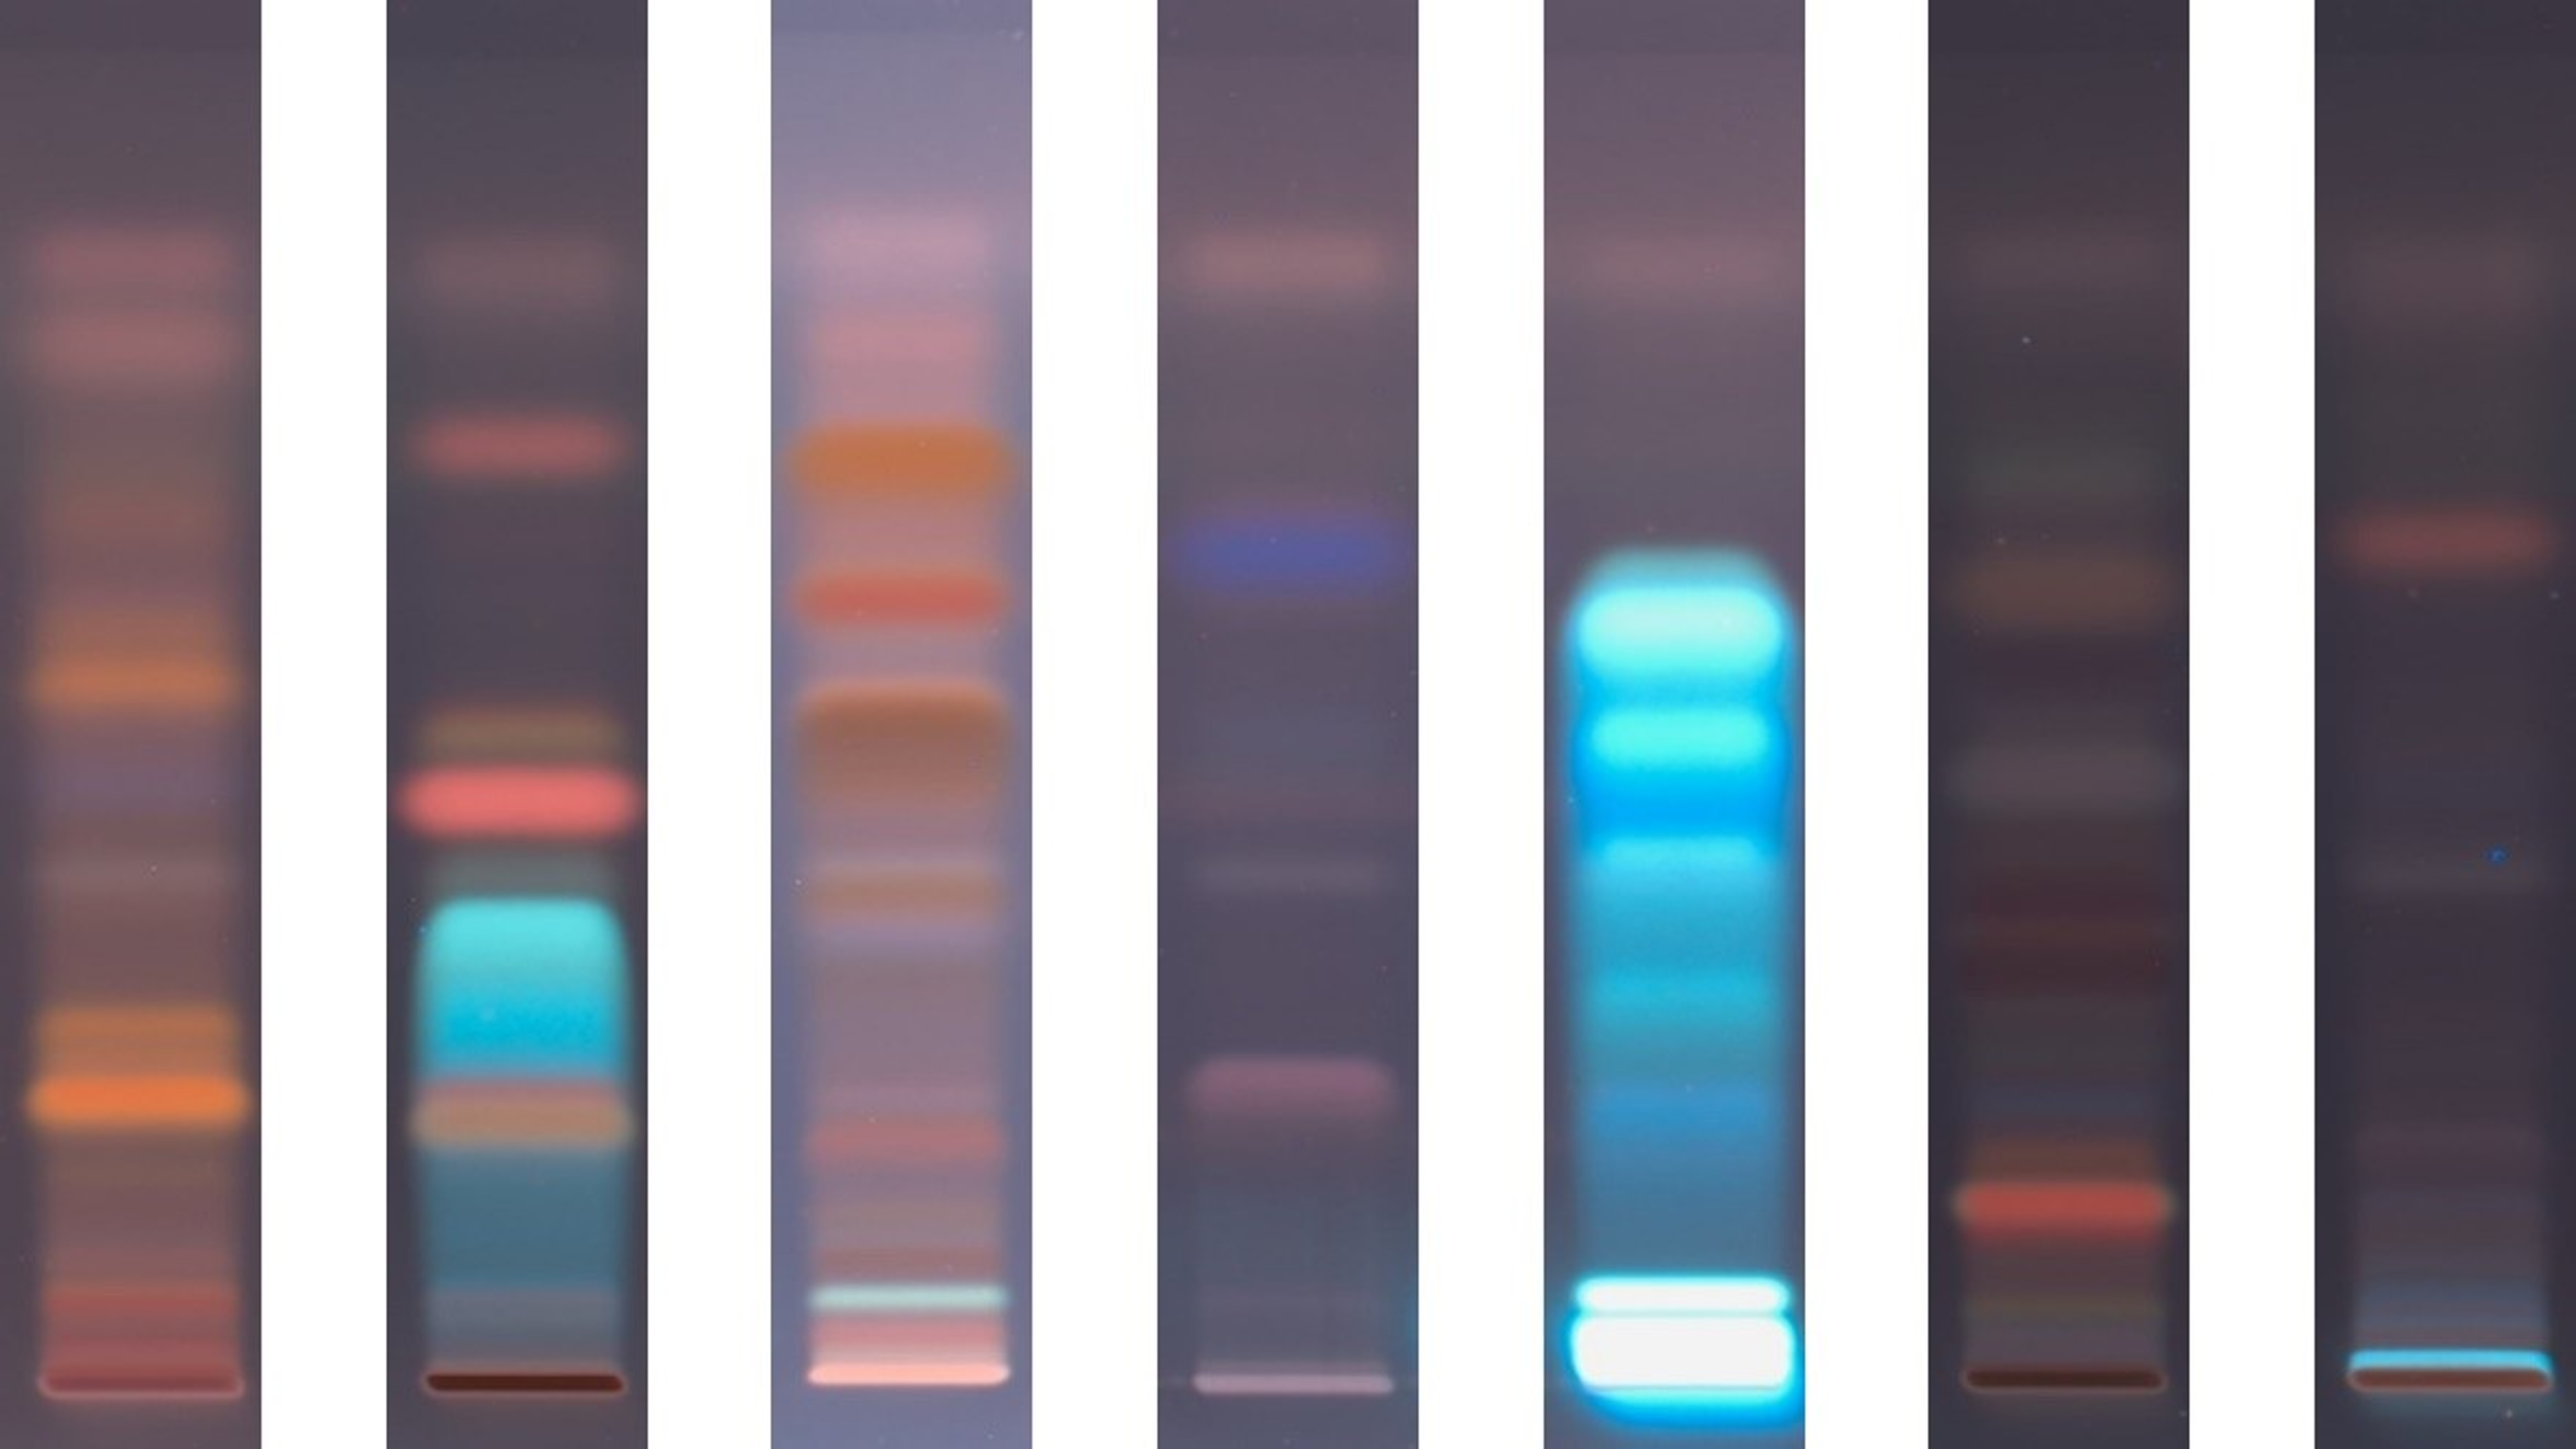
As shown below, clear dose-dependent fluorescence intensity signals are observed for the reference compounds E1, EE2, E2, and E3 following the MUG-cleavage reaction. The levels of the analyte EE2 range from 0.1 to 10 pg per lane. On the right side, results for spiked and unspiked surface water are presented, along with a blank sample.
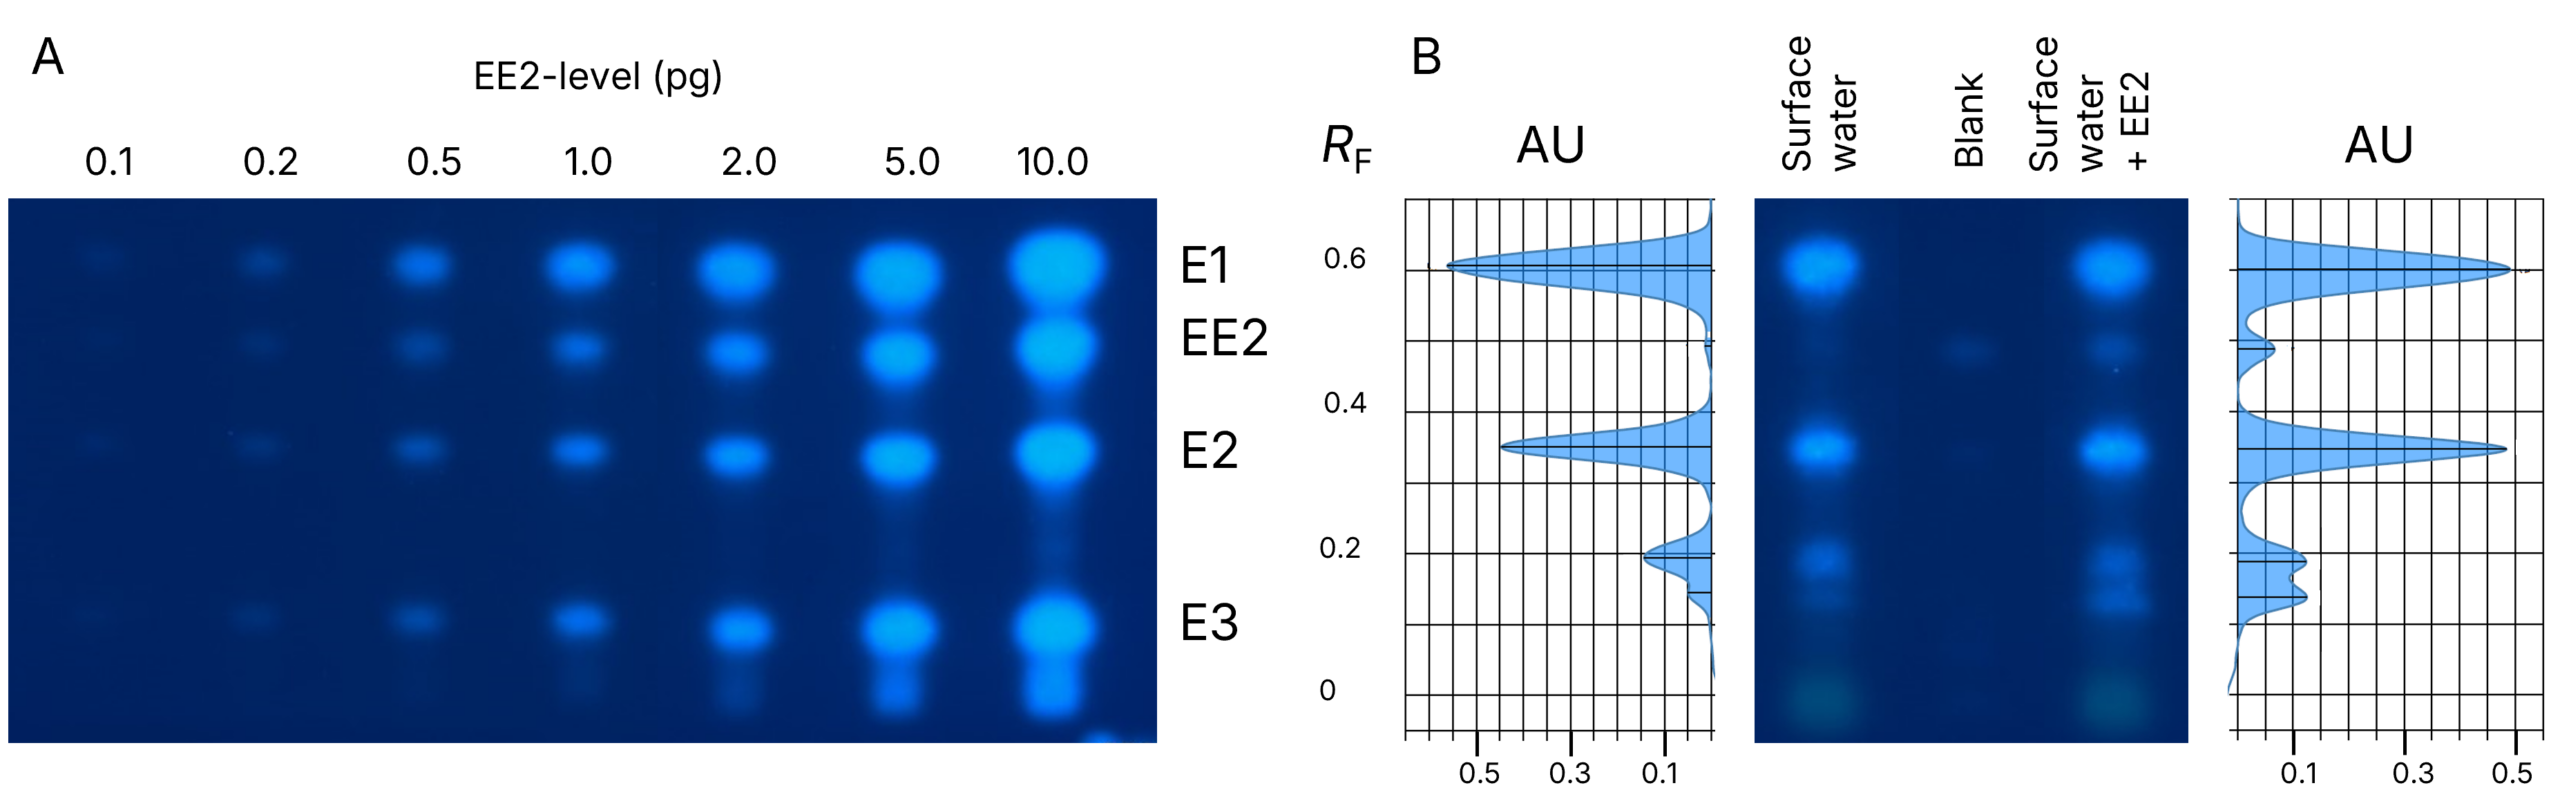
HPTLC bioautograms: A. Dose response relationship of the reference compounds and B. spiked and unspiked methanolic samples as well as the blank, detection at UV 366 nm
A clear separation of the priority compounds E1, E2, and EE2 was observed. The compounds E1 and E2 were detected as well in the unspiked water sample. In addition to these target compounds, signals at lower RF values suggest the presence of other estrogenic compounds in the sample, highlighting the method’s detection potential.
Due to the complexity of environmental samples, co-migration of other estrogenic compounds at the same RF values as the priority compounds cannot be excluded.
If needed, additional chemical confirmation is recommended to fully assess the contributions of individual compounds to the overall estrogenic activity, further underscoring the advantages of the HPTLC approach.
The estrogenic profiles of the spiked and unspiked samples are consistent, and the signal triggered by the spiked EE2 is clearly detectable. A signal at the EE2 RF is also visible in the blank control. This background signal was similarly reported by other laboratories participating in the interlaboratory trial.
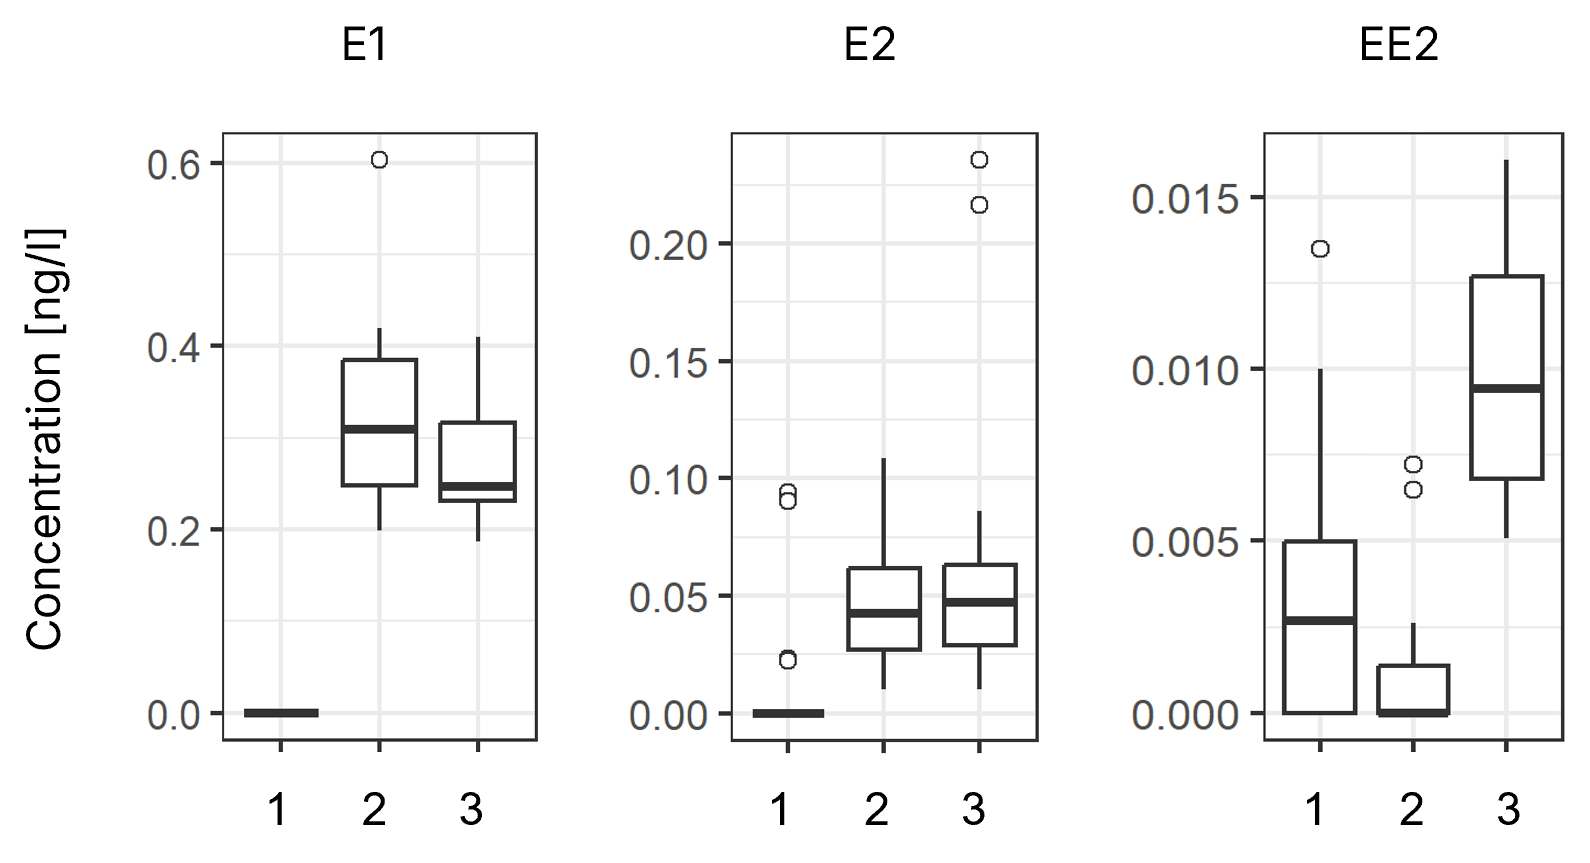
Boxplots of quantitative data for the priority compounds E1, E2, and EE2. 1: blank, 2: surface water, 3: surface water spiked with EE2. Median is indicated by a bold line, the inter-quartile range (IQR) by boxes, the 1.5-fold IQR by whiskers, and outliers are indicated by open circles.
Quantitative analysis of the priority compounds E1 (n=14 per sample), E2 (n=20 per sample), and EE2 (n=20 per sample) is presented in the figure above. For the environmental samples, i.e., surface water from the Rhine River (sample 2) and spiked surface water (sample 3), individual data points were identified as outliers, indicated by open circles. After exclusion of these outliers, the mean concentrations of E1 in samples 2 and 3 were 0.31 ng/L and 0.28 ng/L, with relative standard errors of 6.6% and 6.2%, respectively.
The mean concentrations of E2 were 0.046 ng/L and 0.045 ng/L, with relative standard errors of 13.2% and 11.4%, respectively. The mean concentration of EE2 in the spiked sample was 0.009 ng/L, with a relative standard error of 8.0%.
Some laboratories detected a signal at the same RF as EE2 in the unspiked water sample, with an overall mean of 0.001 ng/L, and in the blank sample, with an overall mean of 0.003 ng/L. Although the EE2-spike is clearly detectable relative to the unspiked sample and the blank, further efforts are required to reduce potential interferences, including artificial signals likely due to contamination (e.g., during sample application).
Regarding trueness, the method overestimated the spiked EE2-concentration of 5 pg/L by 80%, and by 20% after subtraction of the blank value. Despite this observed interference, which requires further investigation and optimization, this study demonstrates the potential of the approach for detecting estrogenic compounds in environmental samples.
Importantly, the method meets the requirement of a limit of quantification corresponding to 30% of the EQS, which is 5.1 pg/L for EE2. Following the planned publication of a DIN technical specification on “Sensitive detection of estrogenic compounds in surface water using p-YES”, the method will be proposed for full validation in line with ISO standardization.
Literature
[1] Kidd et al. Proceedings of the national academy of sciences, 104 (2007), 8897.
[2] Arlos et al. Water Research, 139 (2018), 187.
[3] Lalik et al. Analytical Chemistry, 97 (2025), 8654.
[4] Schoenborn et al. Journal of Chromatography A, 1530 (2017), 185.
[5] Mc Donnell et al. J Steroid Biochem Mol Biol, 39 (1991), 291.
Contact: Dr. Sebastian Buchinger, German Federal Institute of Hydrology, Department Biochemistry and Ecotoxicology, Am Mainzer Tor 1, 56068 Koblenz, Germany.