
HPTLC for stability testing of dihydroartemisinin
Amit Palande, application specialist under the guidance of Akshay Charegaonkar (managing director), Tukaram Thite (senior lab manager) and Dr. Saikat Mallick (lab manager) work at Anchrom Enterprises Pvt Ltd, Mumbai, India. The company specializes in instrumental planar chromatography, and develops new, quantitative, and regulatory compliant analytical methods for pharmaceutical formulations, APIs, herbal products, food products, organic intermediates, dyes etc. Mr. Palande benefits from HPTLC because it is a fast, simple, economical and flexible, “visible chromatography” technique. HPTLC is risk-free and multiple detections can be made without repeating chromatography. This is especially helpful for dihydroartemisinin, because it is not UV absorbing and needs derivatization for densitometric detection.
Introduction
Dihydroartemisinin (also known as dihydroqinghaosu, artenimol or DHA) is a drug used to treat malaria. It is globally recognized for its efficacy and safety in the clinical treatment of malaria for decades. DHA is the active metabolite of all artemisinin compounds (artemisinin, artesunate, artemether, etc.) and is also available as a drug by itself. It is a semi-synthetic derivative of artemisinin and is widely used as an intermediate in the preparation of other artemisinin derived antimalarial drugs. DHA is often combined with piperaquine phosphate (PPQ). Like any formulation, these tablets need to be tested for shelf life i.e. stability.
Shelf-life studies are performed by accelerated or forced degradation studies as per ICH guidelines Q 1 A (R2).
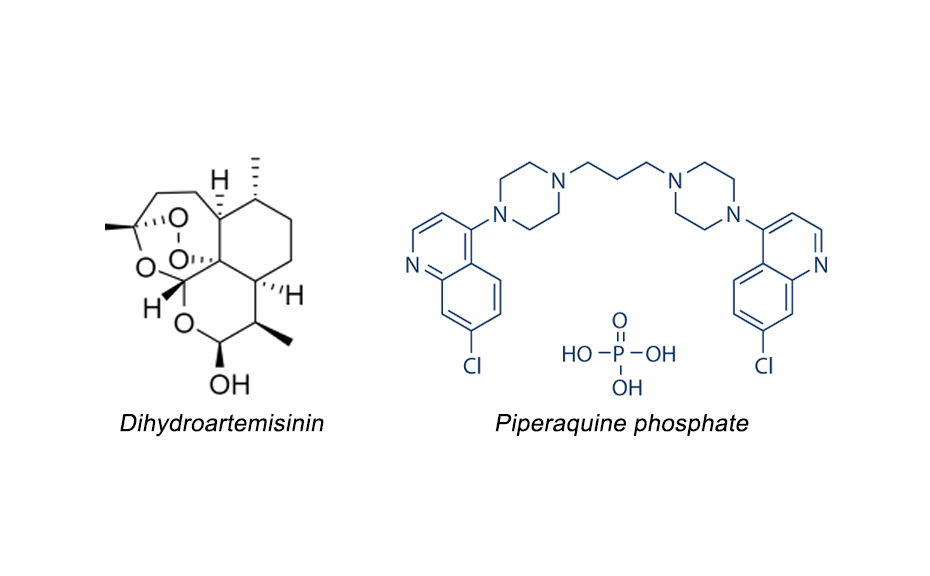
Chemical structures of dihydroartemisinin and piperaquine phosphate
HPTLC is well suited for stability studies, because it is inexpensive and time-saving. Accelerated degradation studies need a very large number of samples to be analyzed. By HPTLC, 15-20 samples can be quantified simultaneously on one plate in about 40–80 minutes. The solvent consumption is only about 20 mL for those 20 samples and little waste is produced. It was separately established, that piperaquine phosphate did not degrade in the studies. Hence a method was developed that kept piperaquine phosphate at the base of the chromatogram but selectively moved DHA and its two degradation products. DHA and the degradation products were detected by simple derivatization and then quantitatively evaluated.
HPTLC is a cost-effective and time-saving technique for the pharma industry, which deals with a heavy load of samples, also competition to introduce a new formulation is very intense. The presented method is a green method, which only uses 20 mL of solvent for 15–20 samples and produces almost no waste. Since the degradation products are unknown, the common procedure of establishing the calibration function using the diluted main substance (DHA in this case) was applied. Many times, as in this case, the samples have to be overloaded to detect the small quantities of impurities/degradation products.
Standard solutions
A stock solution of 1.0 mg/mL of dihydroartemisinin in acetonitrile is prepared and diluted 1:20 (V/V) for analysis.
Sample preparation
Ten tablets containing 40.0 mg of dihydroartemisinin and 320.0 mg of piperaquine phosphate are milled. Powdered tablets equivalent to 100.0 mg of DHA are transferred in a 20.0 mL volumetric flask and dissolved in acetonitrile. The supernatant after centrifugation is used for application.
Chromatogram layer
HPTLC plates silica gel 60 F254 (Merck), 20 x 10 cm are used.
Sample application
Samples and standard solutions are applied as bands with the Automatic TLC Sampler (ATS 4), 15 tracks, band length 8.0 mm, distance from left edge 20.0 mm, distance from lower edge 8.0 mm. 10 μL for sample and standard solutions are applied.
Chromatography
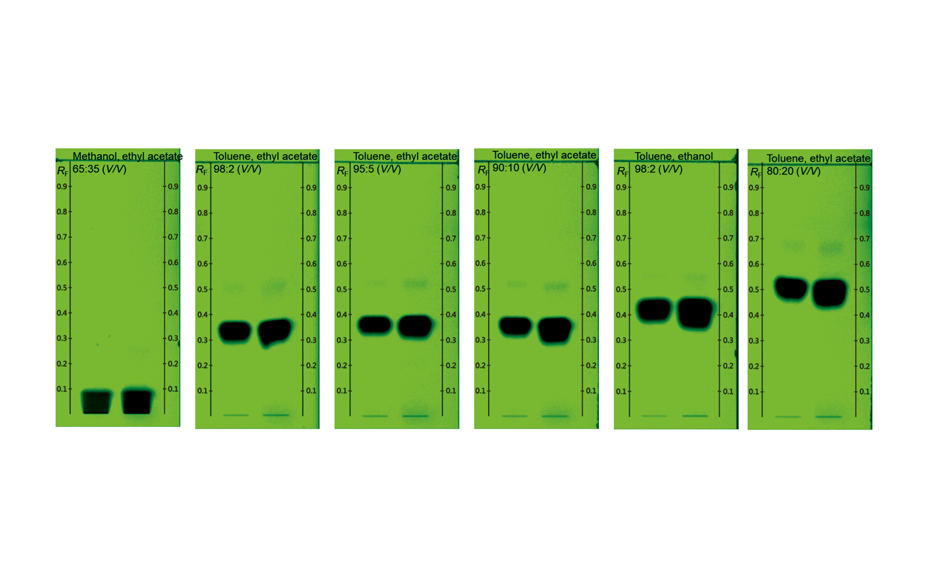
Plates are developed in a 20 x 10 cm Twin Trough Chamber with chamber saturation (with filter paper) for 20min, development with cyclohexane – ethyl acetate – glacial acetic acid 10:5:1 (V/V) to the migration distance of 90 mm (from the lower edge), followed by drying for 5 min.
Post-chromatographic derivatization
Plates are sprayed with 3.0 mL of anisaldehydesulfuric acid reagent (to 170 mL of cooled methanol, 20 mL of acetic acid and 10 mL of sulfuric acid are added, after cooling to room temperature 1mL of anisaldehyde is added) using the CAMAG Derivatizer. After spraying, the plates are heated at 110 °C for 5 min using the TLC Plate Heater.
Documentation
Images of the plate are captured with the TLC Visualizer in UV 366 nm and white light.
Densitometry
Absorbance measurement at 540 nm (tungsten lamp) is performed with CAMAG TLC Scanner 4 and visionCATS, slit dimension 6.00 mm x 0.45 mm, scanning speed 20 mm/s, evaluation via peak area.
Results and discussion
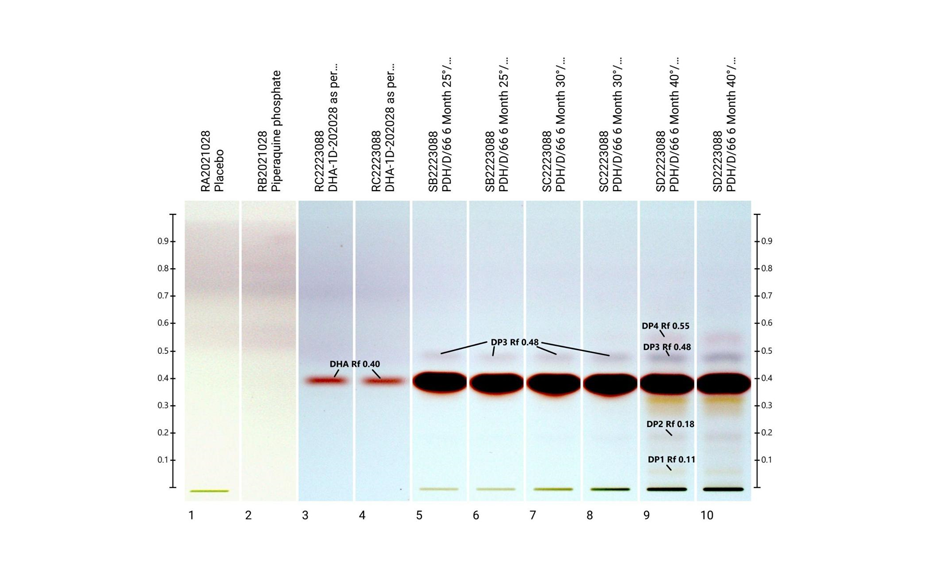
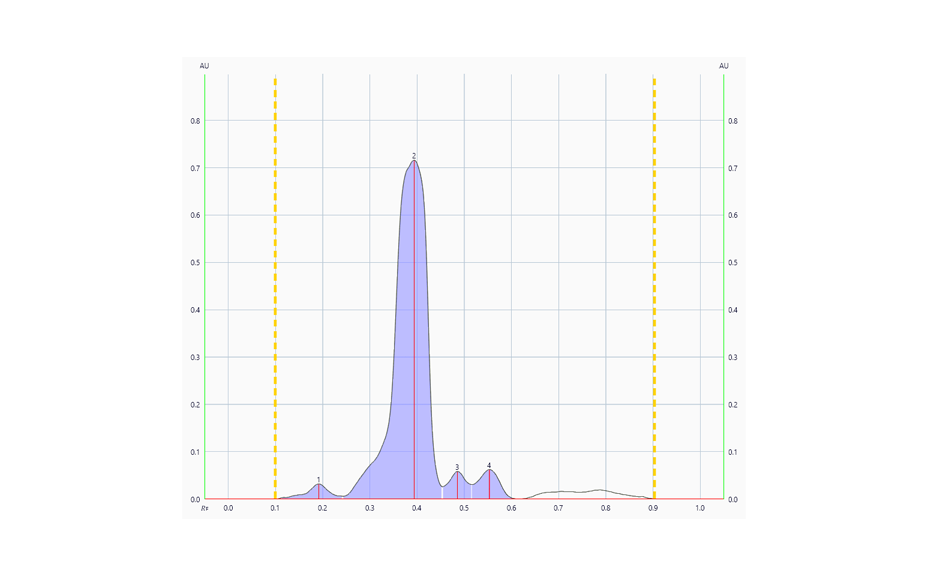
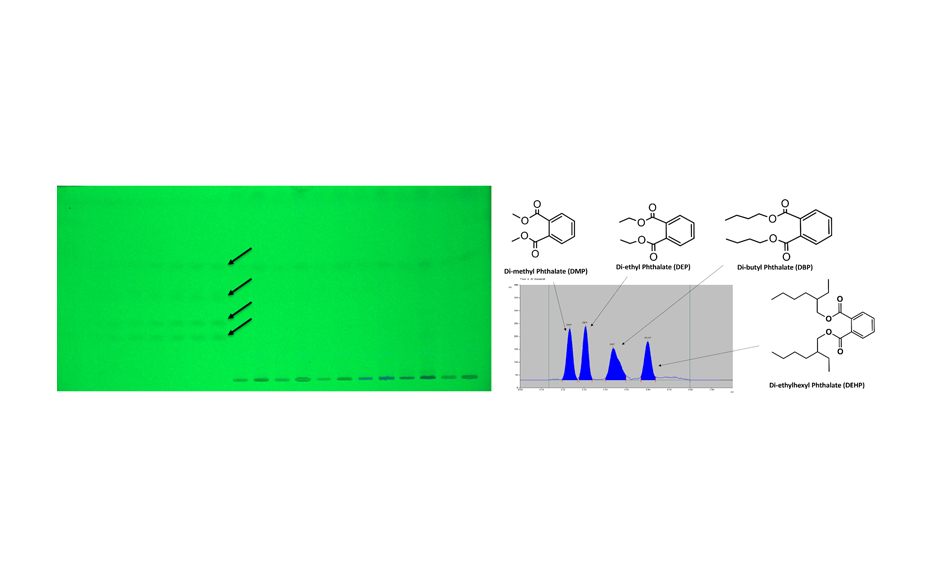
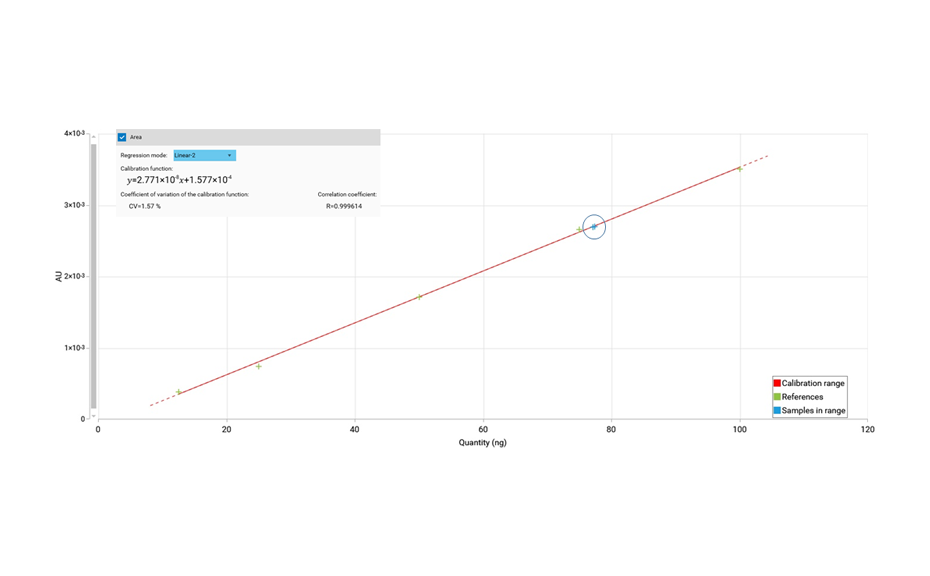
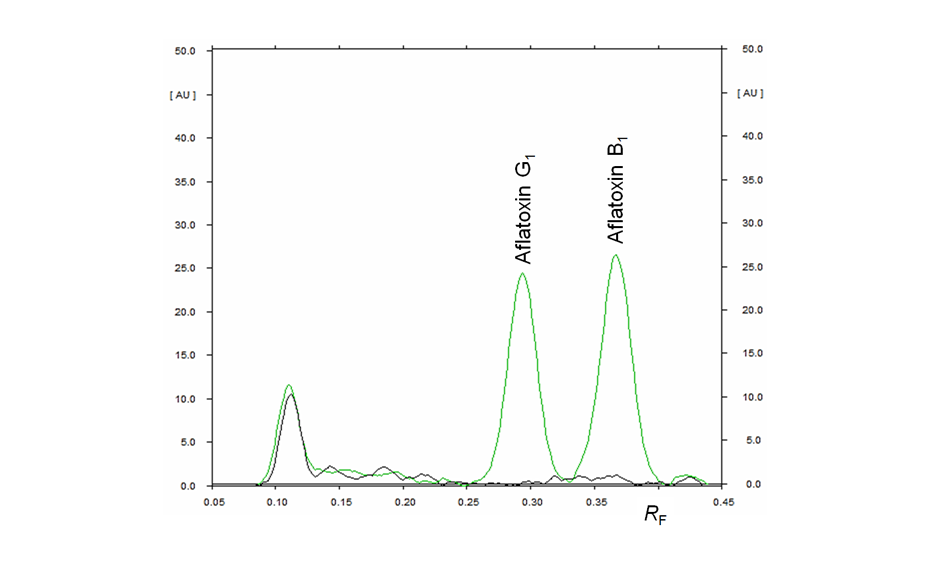
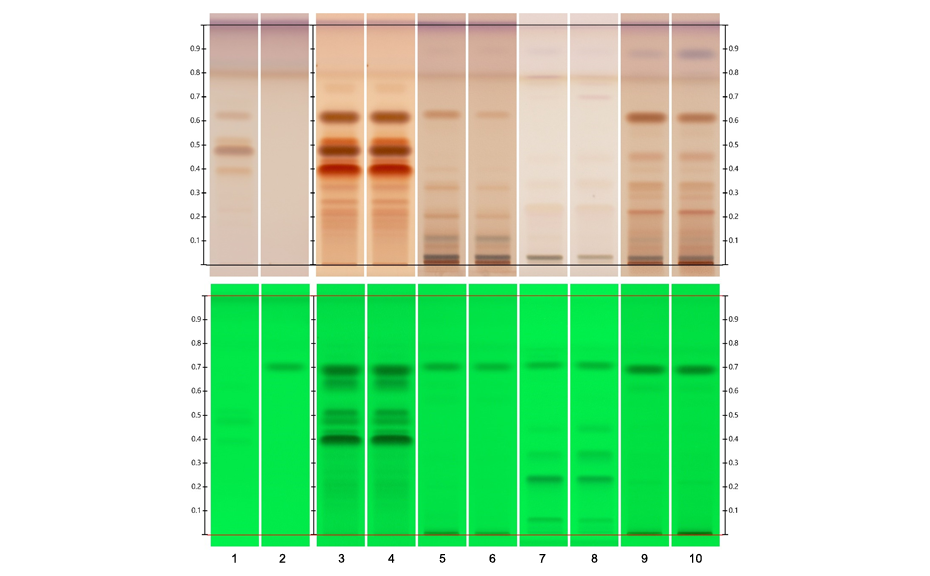
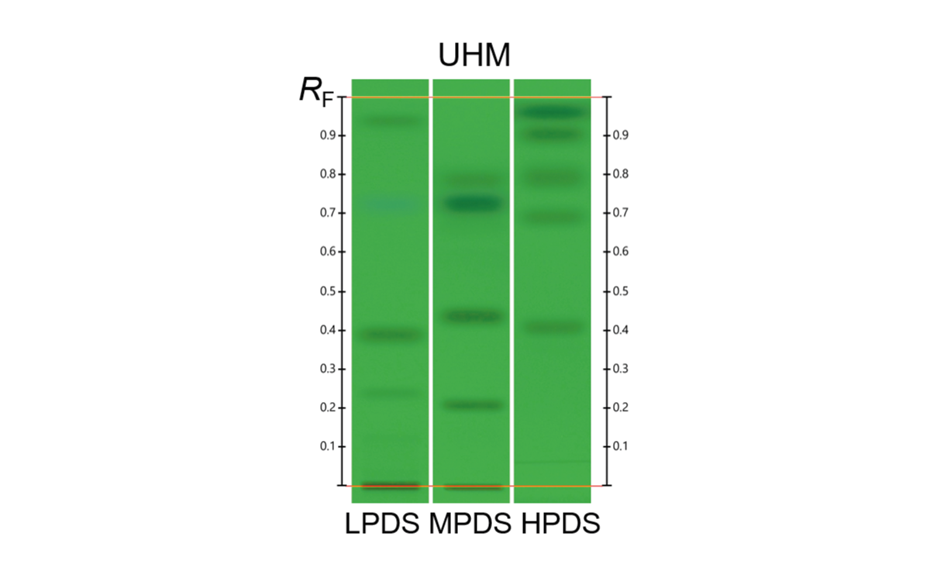
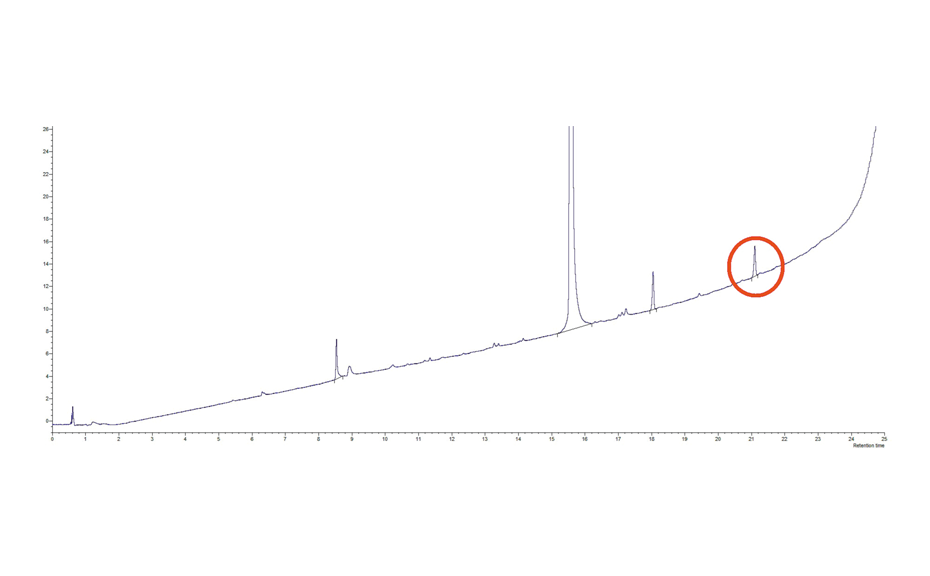
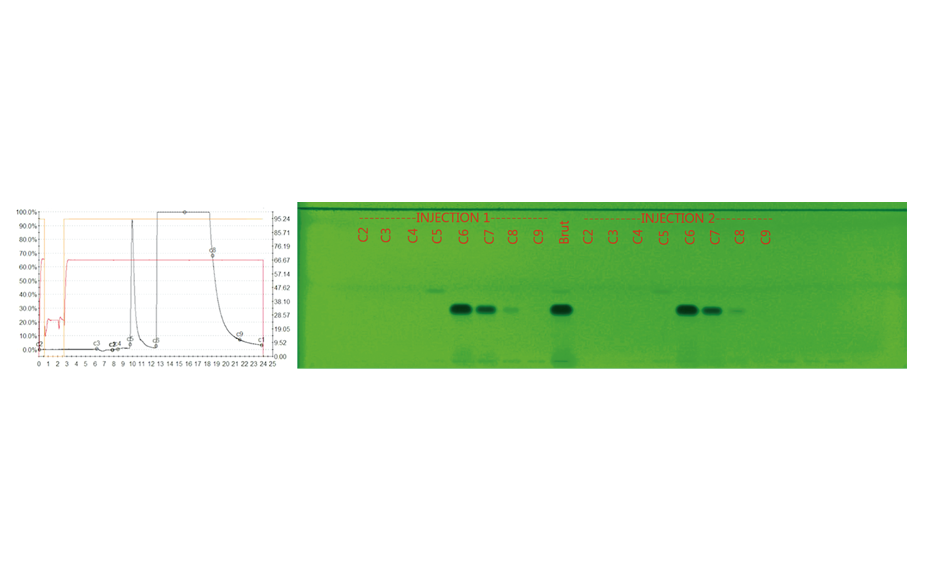
The determination of the degradation product with the mobile phase cyclohexane – ethyl acetate – glacial acetic acid 10:5:1 (V/V) is verified by the positions of the individual drugs, where PPQ remains at the application position and DHA moves to hRF 40. Any other zones at different hRF are reported as degradation products. The placebo shows no zones in the chromatogram. Prior to derivatization, no zones are visible. Quantitative evaluation is performed after derivatization by densitometric absorbance measurement at 540 nm. The data is recorded and used to calculate the degradation products. Total impurities in the samples are found to be within the 1.5% limit as per specification, defined in house. A representative densitogram of a stability batch sample and standard is shown. The area of each impurity is calculated as follows and then summarized.
-
01
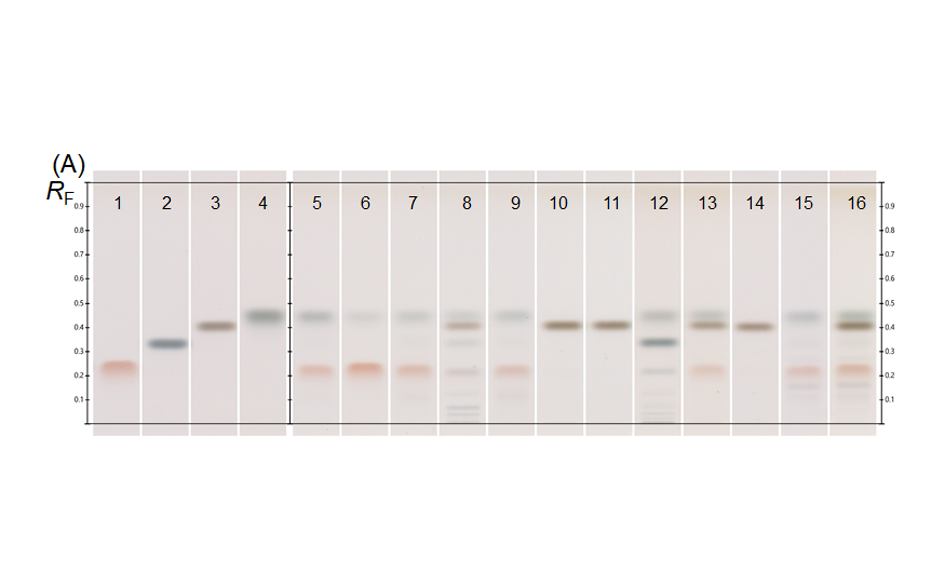
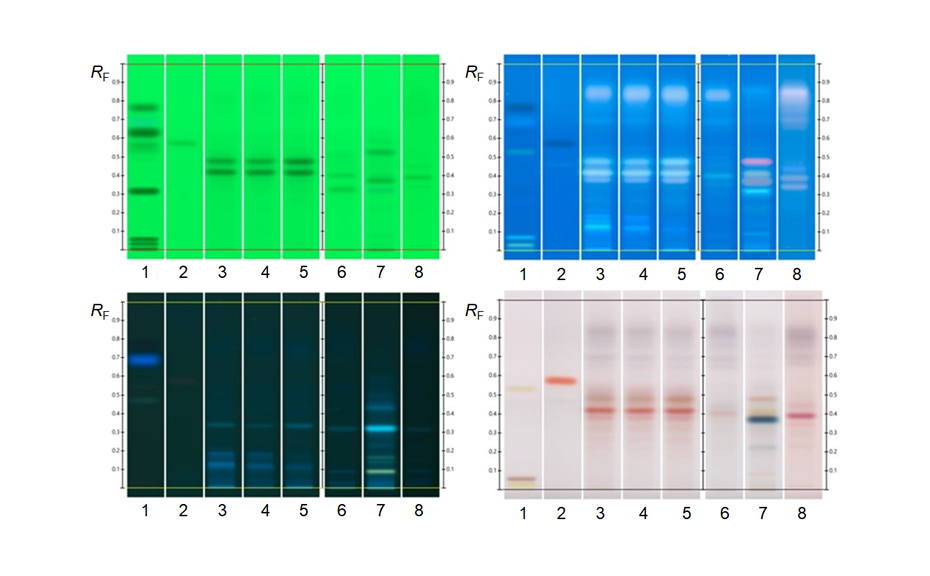
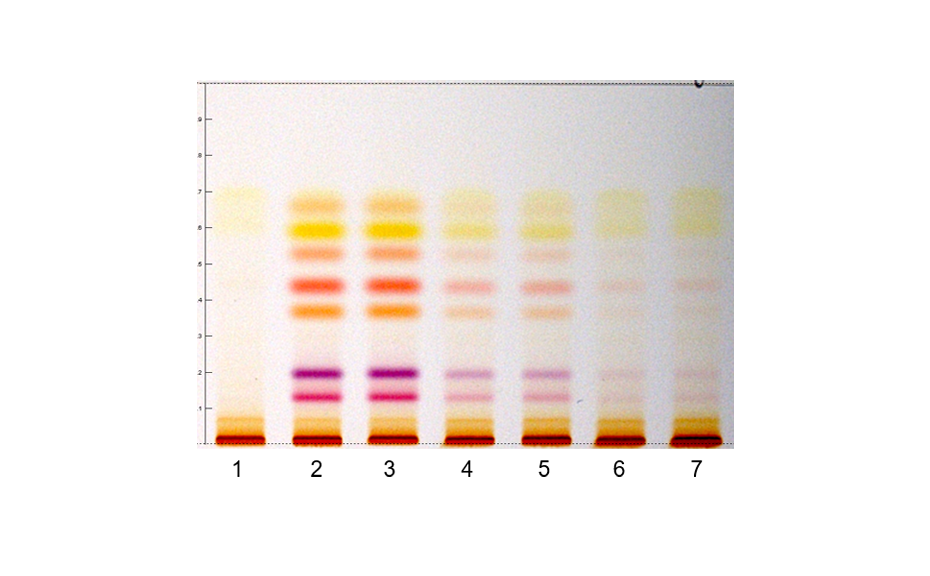
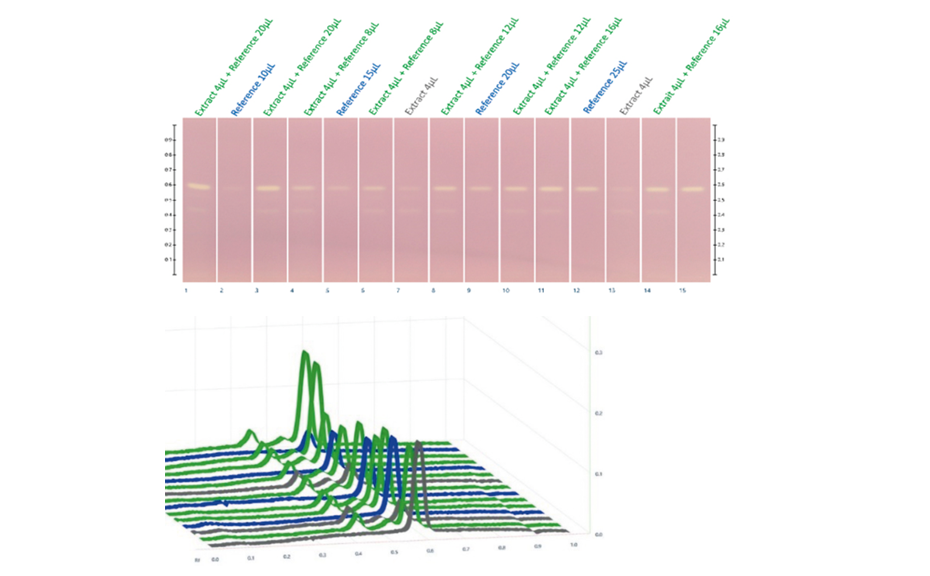
Image in white light after derivatization: Track 1: placebo, track 2: piperaquine phosphate, tracks 3, 4: DHA standard, tracks 5–10: different formulations of tablets in the stability study (DP = degradation product);
-
02
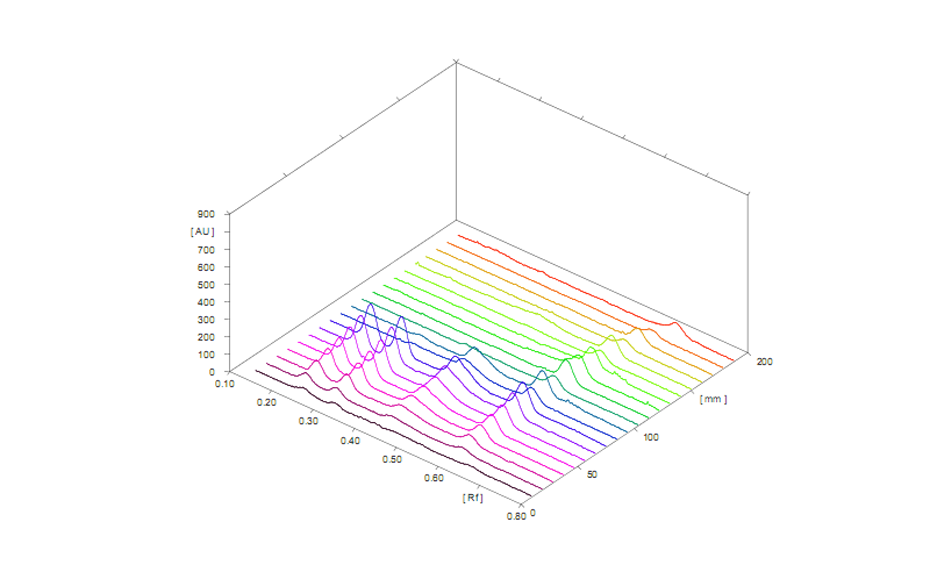
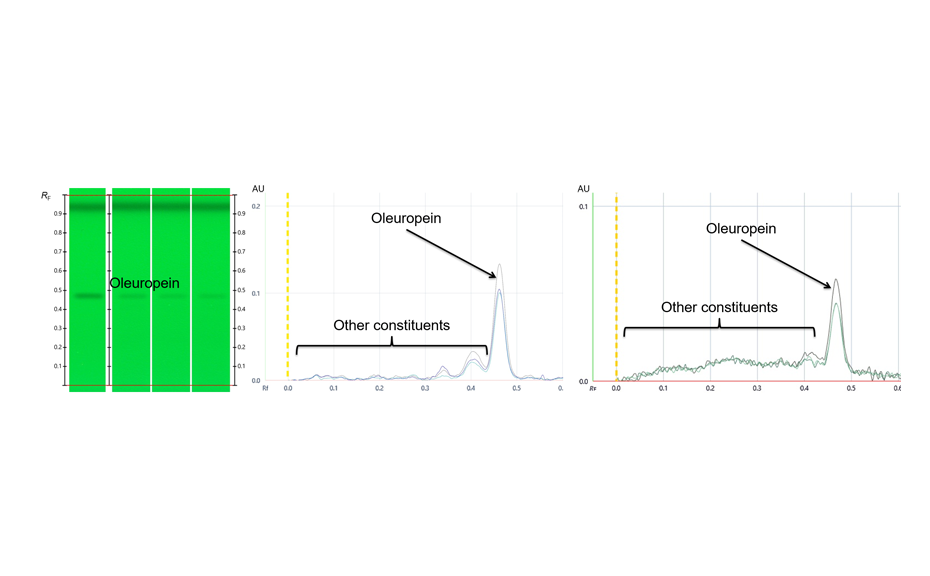
Densitogram at UV 540 nm of a tablet batch in which degradation products were detected.
-
03
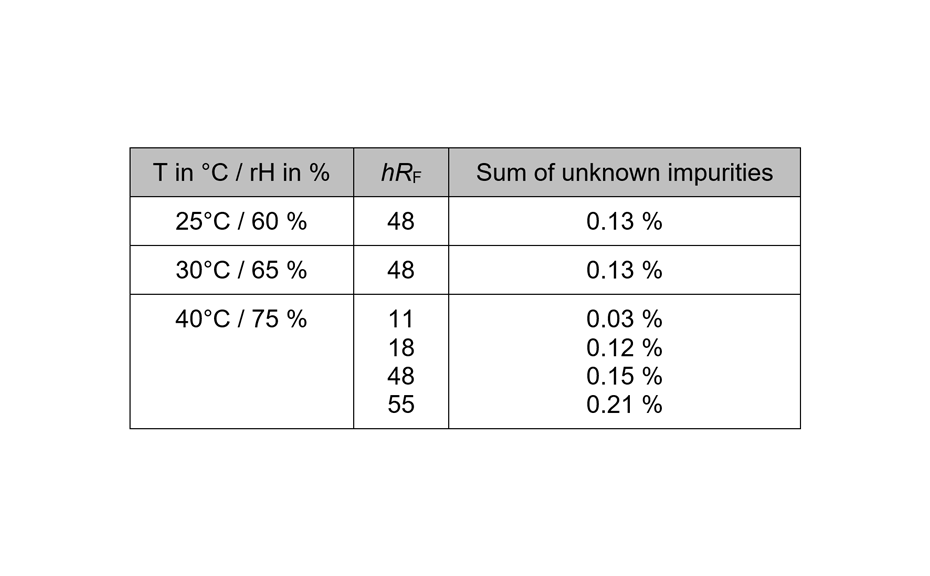
Results of a 6 months old batch
Literature
[1] CAMAG Application Note A-86.1: Determination of artemisinin in Artemisia annua leaf by HPTLC
Contact: Akshay Charegaonkar, A 101-104, Shree Aniket Apartment, Navghar Road, Mulund, Mumbai 400081, India, hptlc@anchrom.in, www.anchrom.in


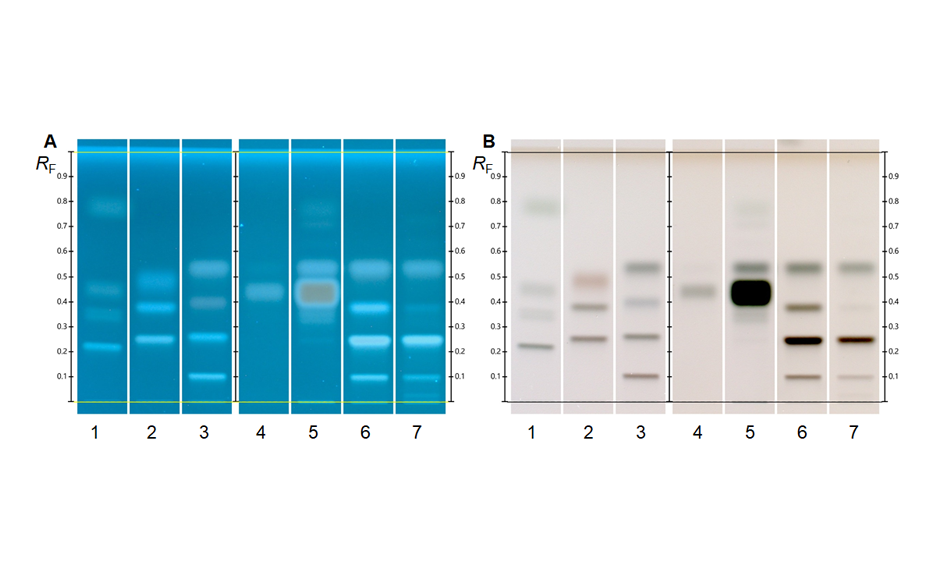

![Figure 3: HPTLC screening of TCM samples for the presence of AAs [in UV 366 nm after derivatization with tin(II) chloride]. From left to right: A. fangji, 1 and 10 μL; AAs mixture 10 and 50 ng (absolute); S. tetrandra adulterated with 10 % an 1 % A. fangji, 10 μL each; pure S. tetrandra 10 μL (shows no zone).](/wp-content/uploads/2024/08/WP5_Fig3_0.png)


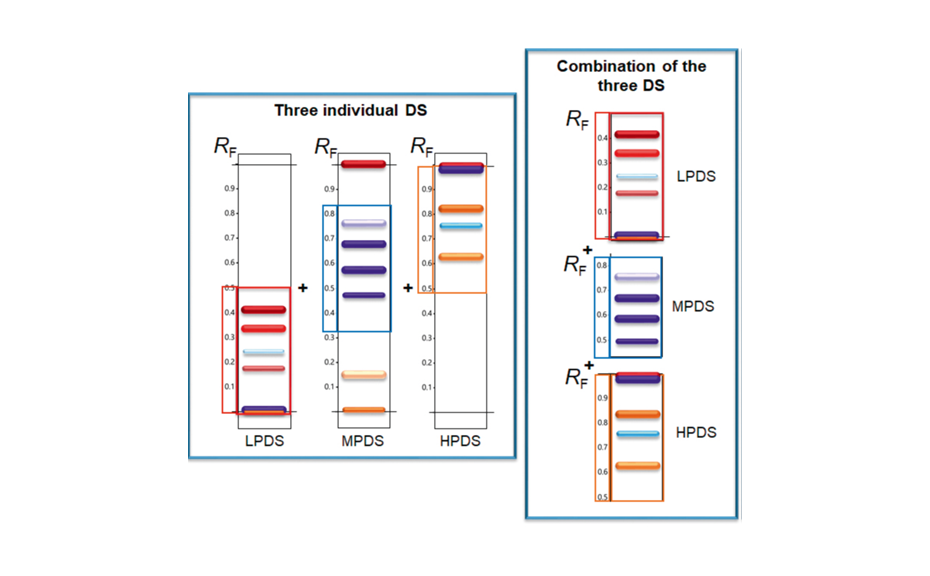
![Detection of 20% Styphnolobium japonicum fruit in Ginkgo biloba leaves with method [3] and CDS](/wp-content/uploads/2024/08/CBS129_Complementary-developing-solvents_img4.png)


![Figure 1: Transformation of the digital image of the HPTLC chromatogram into the corresponding peak profile from image (PPI). Adapted from [2]](/wordpress/wp-content/uploads/2024/08/WP4_Fig1.png)

![Figure 3: Identification – evaluation of multiple samples of Angelica gigas root samples, and average, representative fingerprint (track A) in short-wave UV light 254 nm (upper) and in long-wave UV light 366 nm (bottom). Adapted from [2]](/wordpress/wp-content/uploads/2024/08/WP4_Fig3.png)
![Figure 4: Purity – detection of z-ligustilide (characteristic of the confounding species) in A. gigas root. Image and PPI evaluations. Red bars: peak height of z-ligustilide in mixtures of A. acutiloba and A. gigas root. Blue bars: peak height of z-ligustilide in mixtures of A. sinensis and A. gigas root. Adapted from [2]](/wordpress/wp-content/uploads/2024/08/WP4_Fig4.png)
![Figure 5: Test MC against a reference standard equivalent to the MC. Image and PPI evaluations, and % content of D/DA, of 24 samples of A. gigas root. Adapted from [2]](/wordpress/wp-content/uploads/2024/08/WP4_Fig5.png)