Parameters of High-Performance Thin-Layer Chromatography (Part 2)
Documentation
In contrast to other chromatographic techniques, HPTLC offers the unique advantage to visualize the chromatographic result directly for the human eye, allowing a convenient qualitative evaluation of multiple samples on the same plate. Substances with absorption at 254 nm can be visualized on plates with fluorescence indicator F254 by exposure to short-wave UV light (254 nm). The fluorescence of some substances can be excited by long-wave UV light (366 nm). Substances with or without chromophore can be derivatized for improved detectability.
-
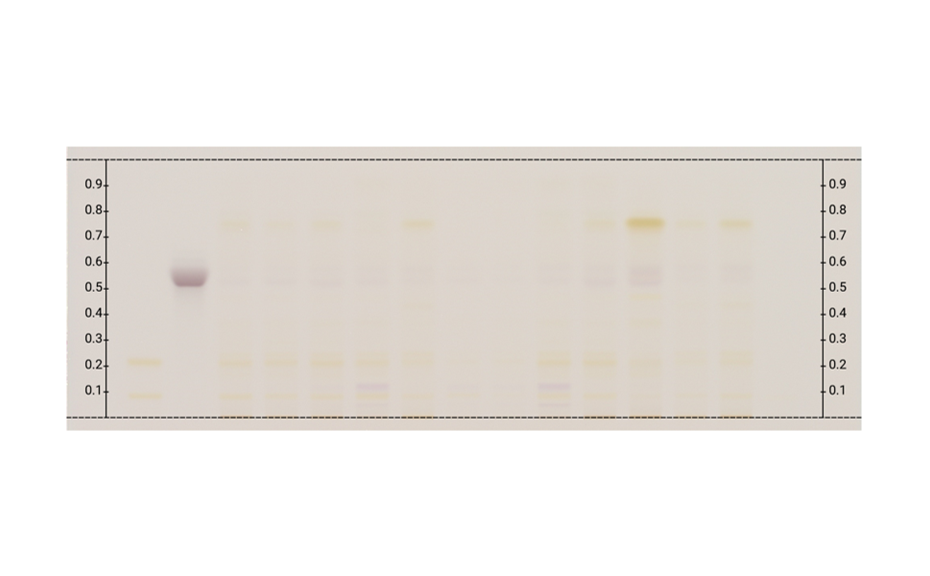
Figure 1a: Image of chromatogram in white light
-
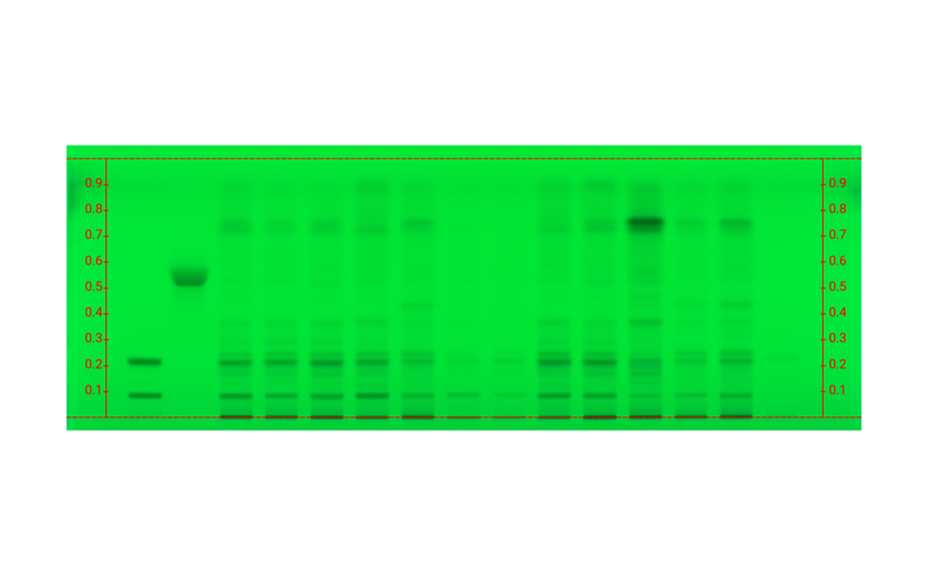
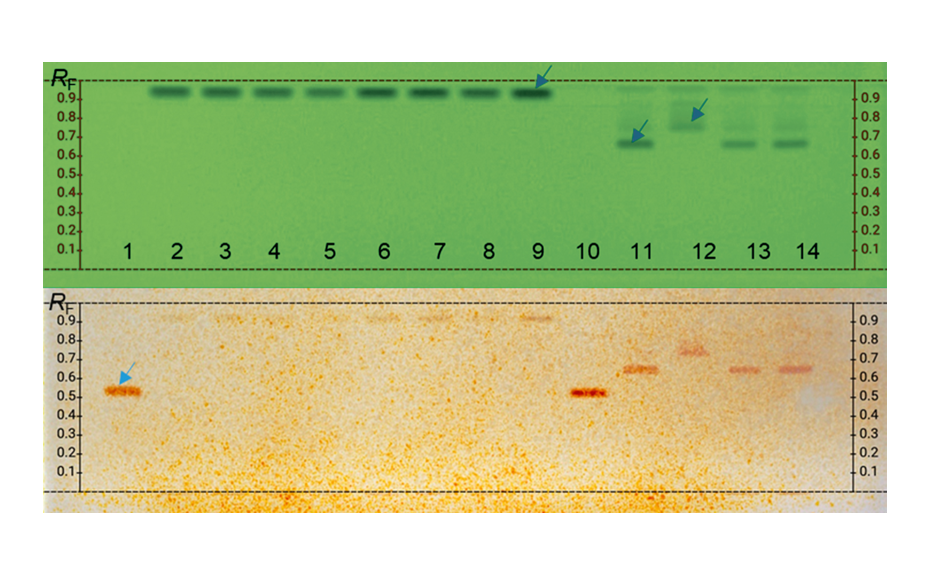
Figure 1b: Image of chromatogram in short-wave UV light (254 nm)
-

Figure 1c: Image of chromatogram in long-wave UV light (366 nm)
With a suitable device (e.g. imaging and documentation system, UV cabinet and digital camera), electronic images of the chromatogram can be captured in different illumination modes. In white light illumination, the light reflected from the layer background is captured. In long-wavelength UV light (366 nm), substances with inherent or reagent induced fluorescence appear as bright spots, often differently colored, on a dark background. When short-wavelength UV light (254 nm) is used, substances absorbing UV 254 appear as dark zones on a bright green or pale blue background, provided the layer contains a fluorescence indicator F254 or F254s (fluorescence quenching).
Using dedicated HPTLC software, these images can be captured, annotated, and archived in compliance with cGxP, and evaluated against the descriptions provided e.g. by pharmacopoeias or other standards. Furthermore, profiles generated from the captured images build the basis for “Comprehensive HPTLC Fingerprinting”.
Instrumentation
CAMAG® TLC Visualizer 2
The visual presentation of the complete chromatogram showing all samples and standards side by side is one of the most convincing arguments for HPTLC. The TLC Visualizer 2 is a professional imaging and documentation system for HPTLC chromatograms, ensuring highest reproducibility in obtaining high-quality images acquired under homogeneous illumination conditions in UV 254 nm, UV 366 nm, and white light in transmission, reflection, and reflection plus transmission mode.
The image enhancement tools featured in the visionCATS software exploit the full potential of the high-end device. Images are automatically captured based on an optimized control of the illumination and parameters specified in the HPTLC method. Sophisticated algorithms guarantee the highest image quality for identification of even the weakest zones. With the Comparison Viewer, tracks originating from the same or different plates and/or different illumination modes can be compared on the same screen side by side, which allows the creation of virtual plates.
Additionally, the visionCATS software enables an image-based evaluation of chromatograms obtained with the TLC Visualizer 2.
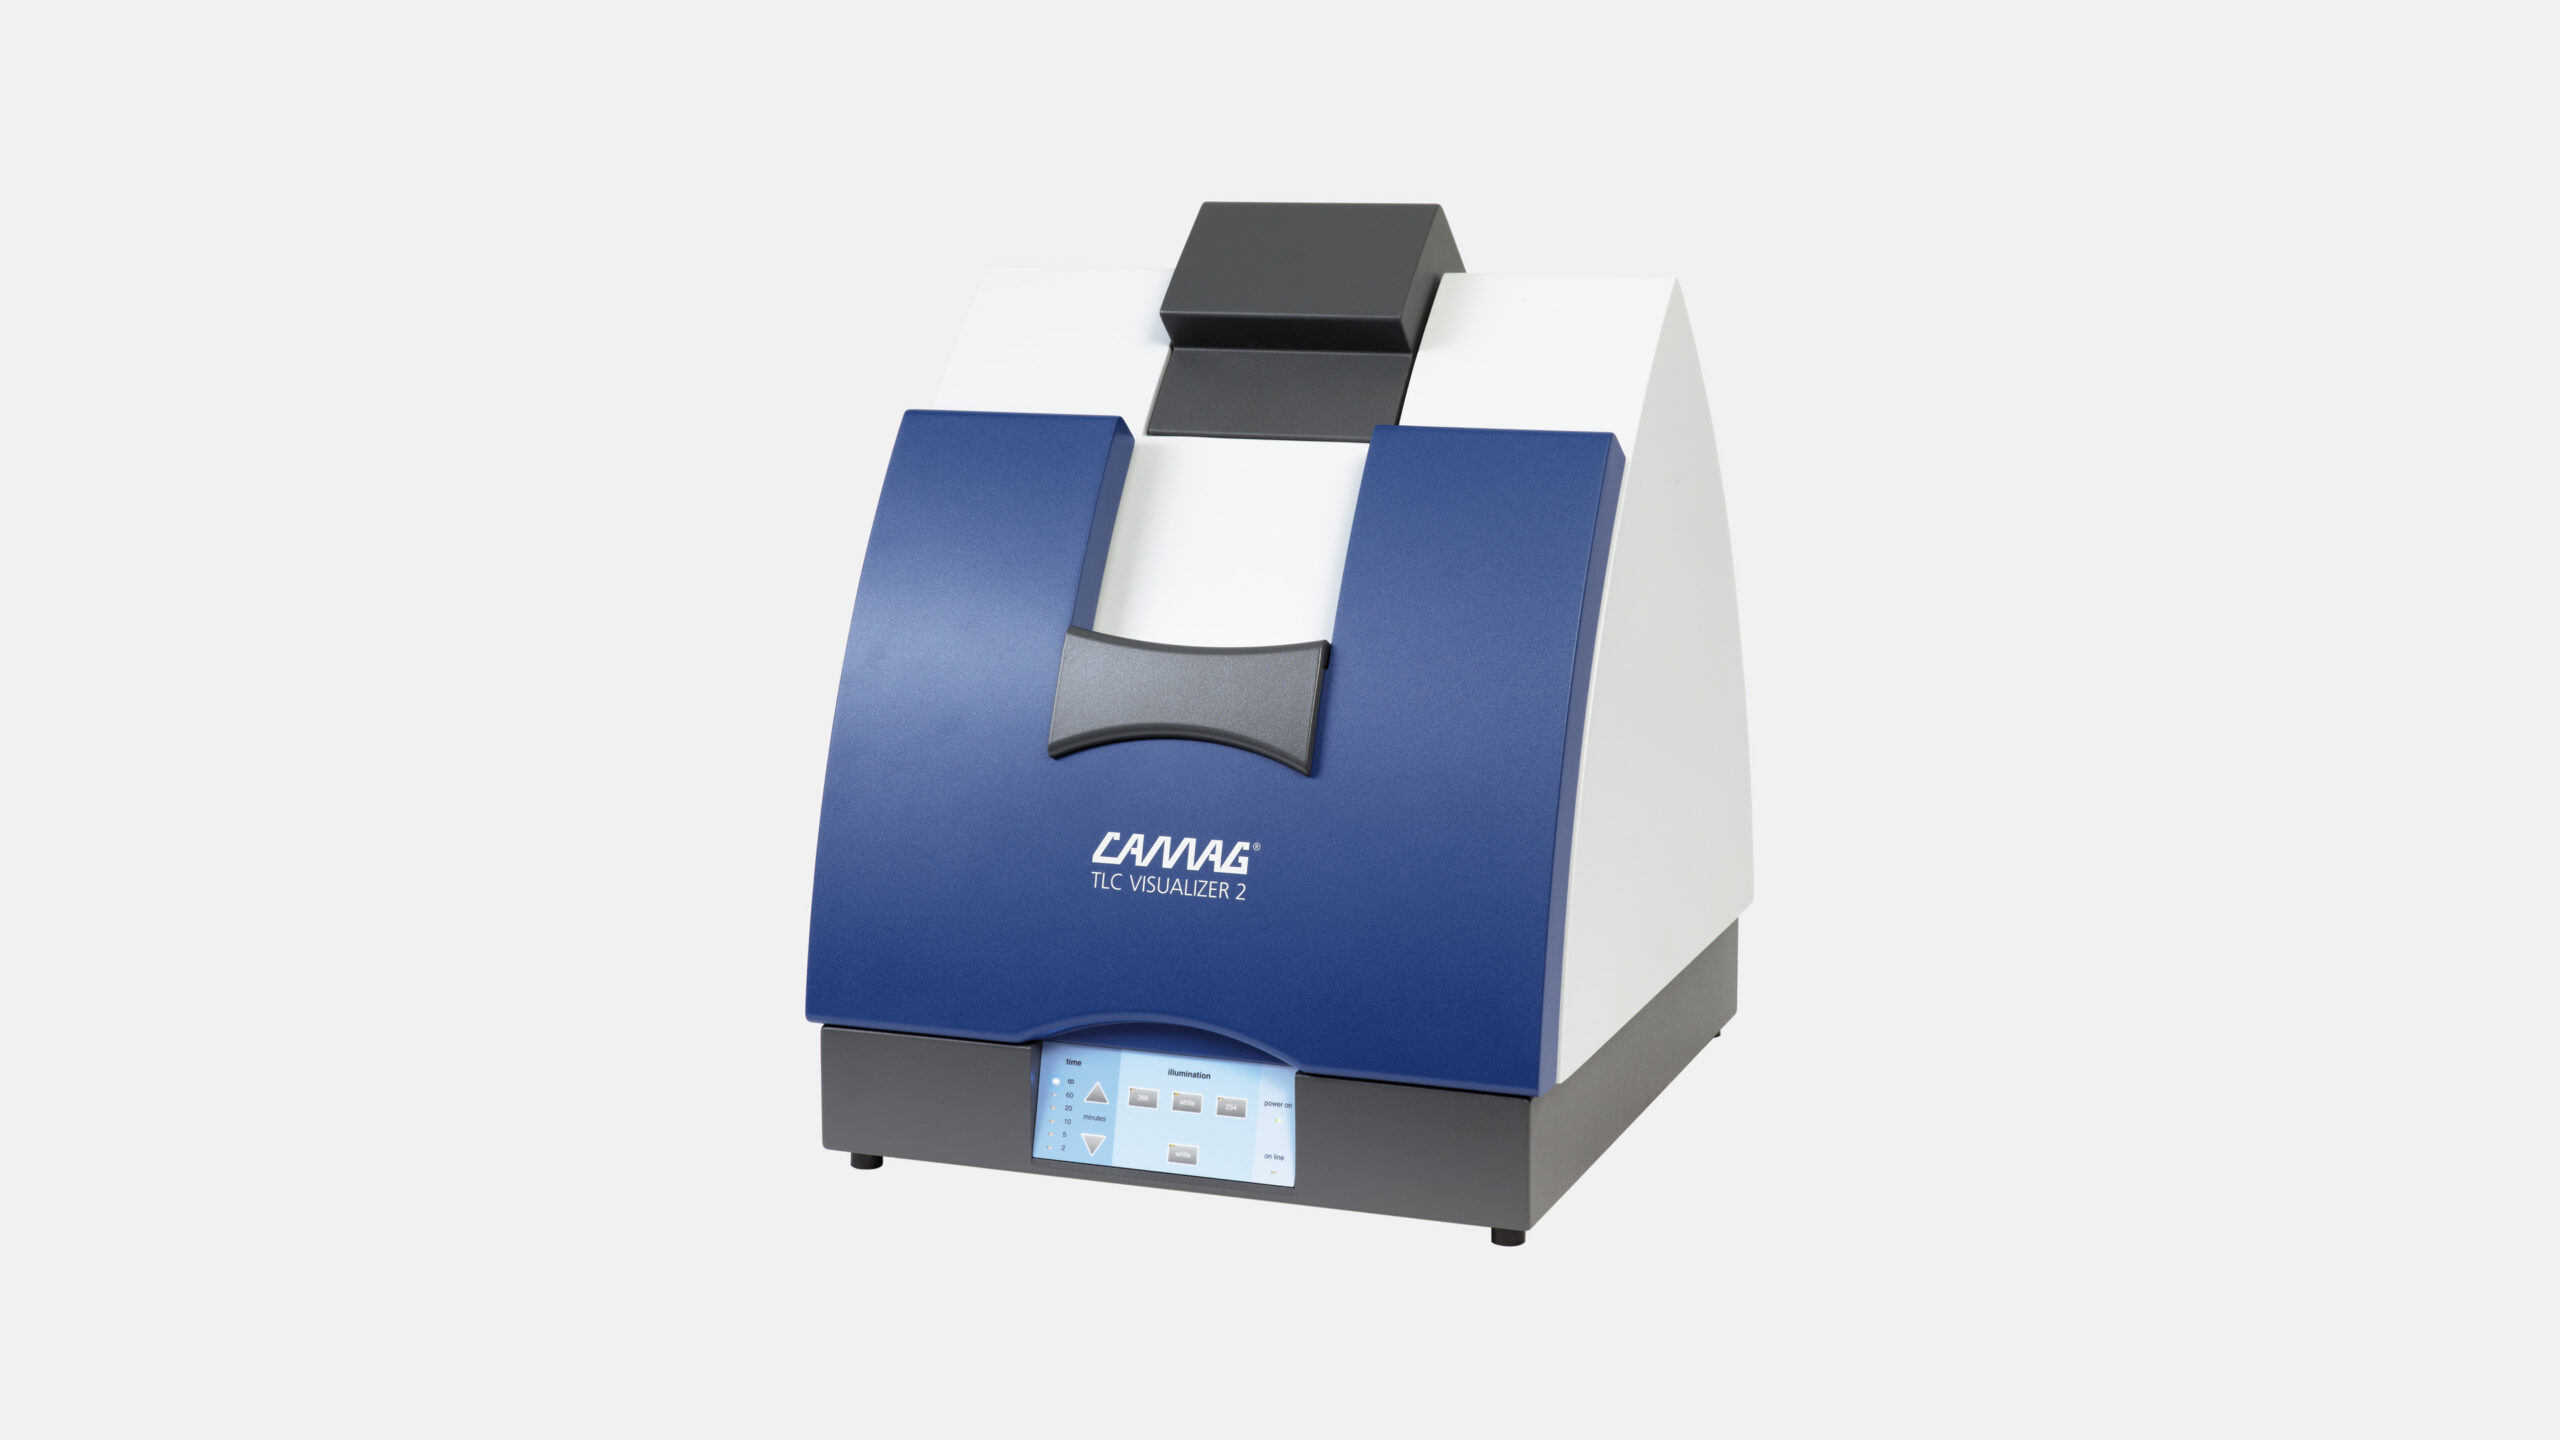
Figure 2: CAMAG® TLC Visualizer 2
CAMAG® UV Cabinet 4
The CAMAG® UV Cabinet 4 consists of the UV Lamp 4 and the Viewing Box 4 and is designed for visual inspection of chromatograms in UV light 254 nm and UV light 366 nm in a bright environment. The interior is accessible via a roller shutter on the front effectively minimizing the influence of ambient light. A glass filter in the viewing window protects the eyes against UV light reflected during visual inspection through the observation port.
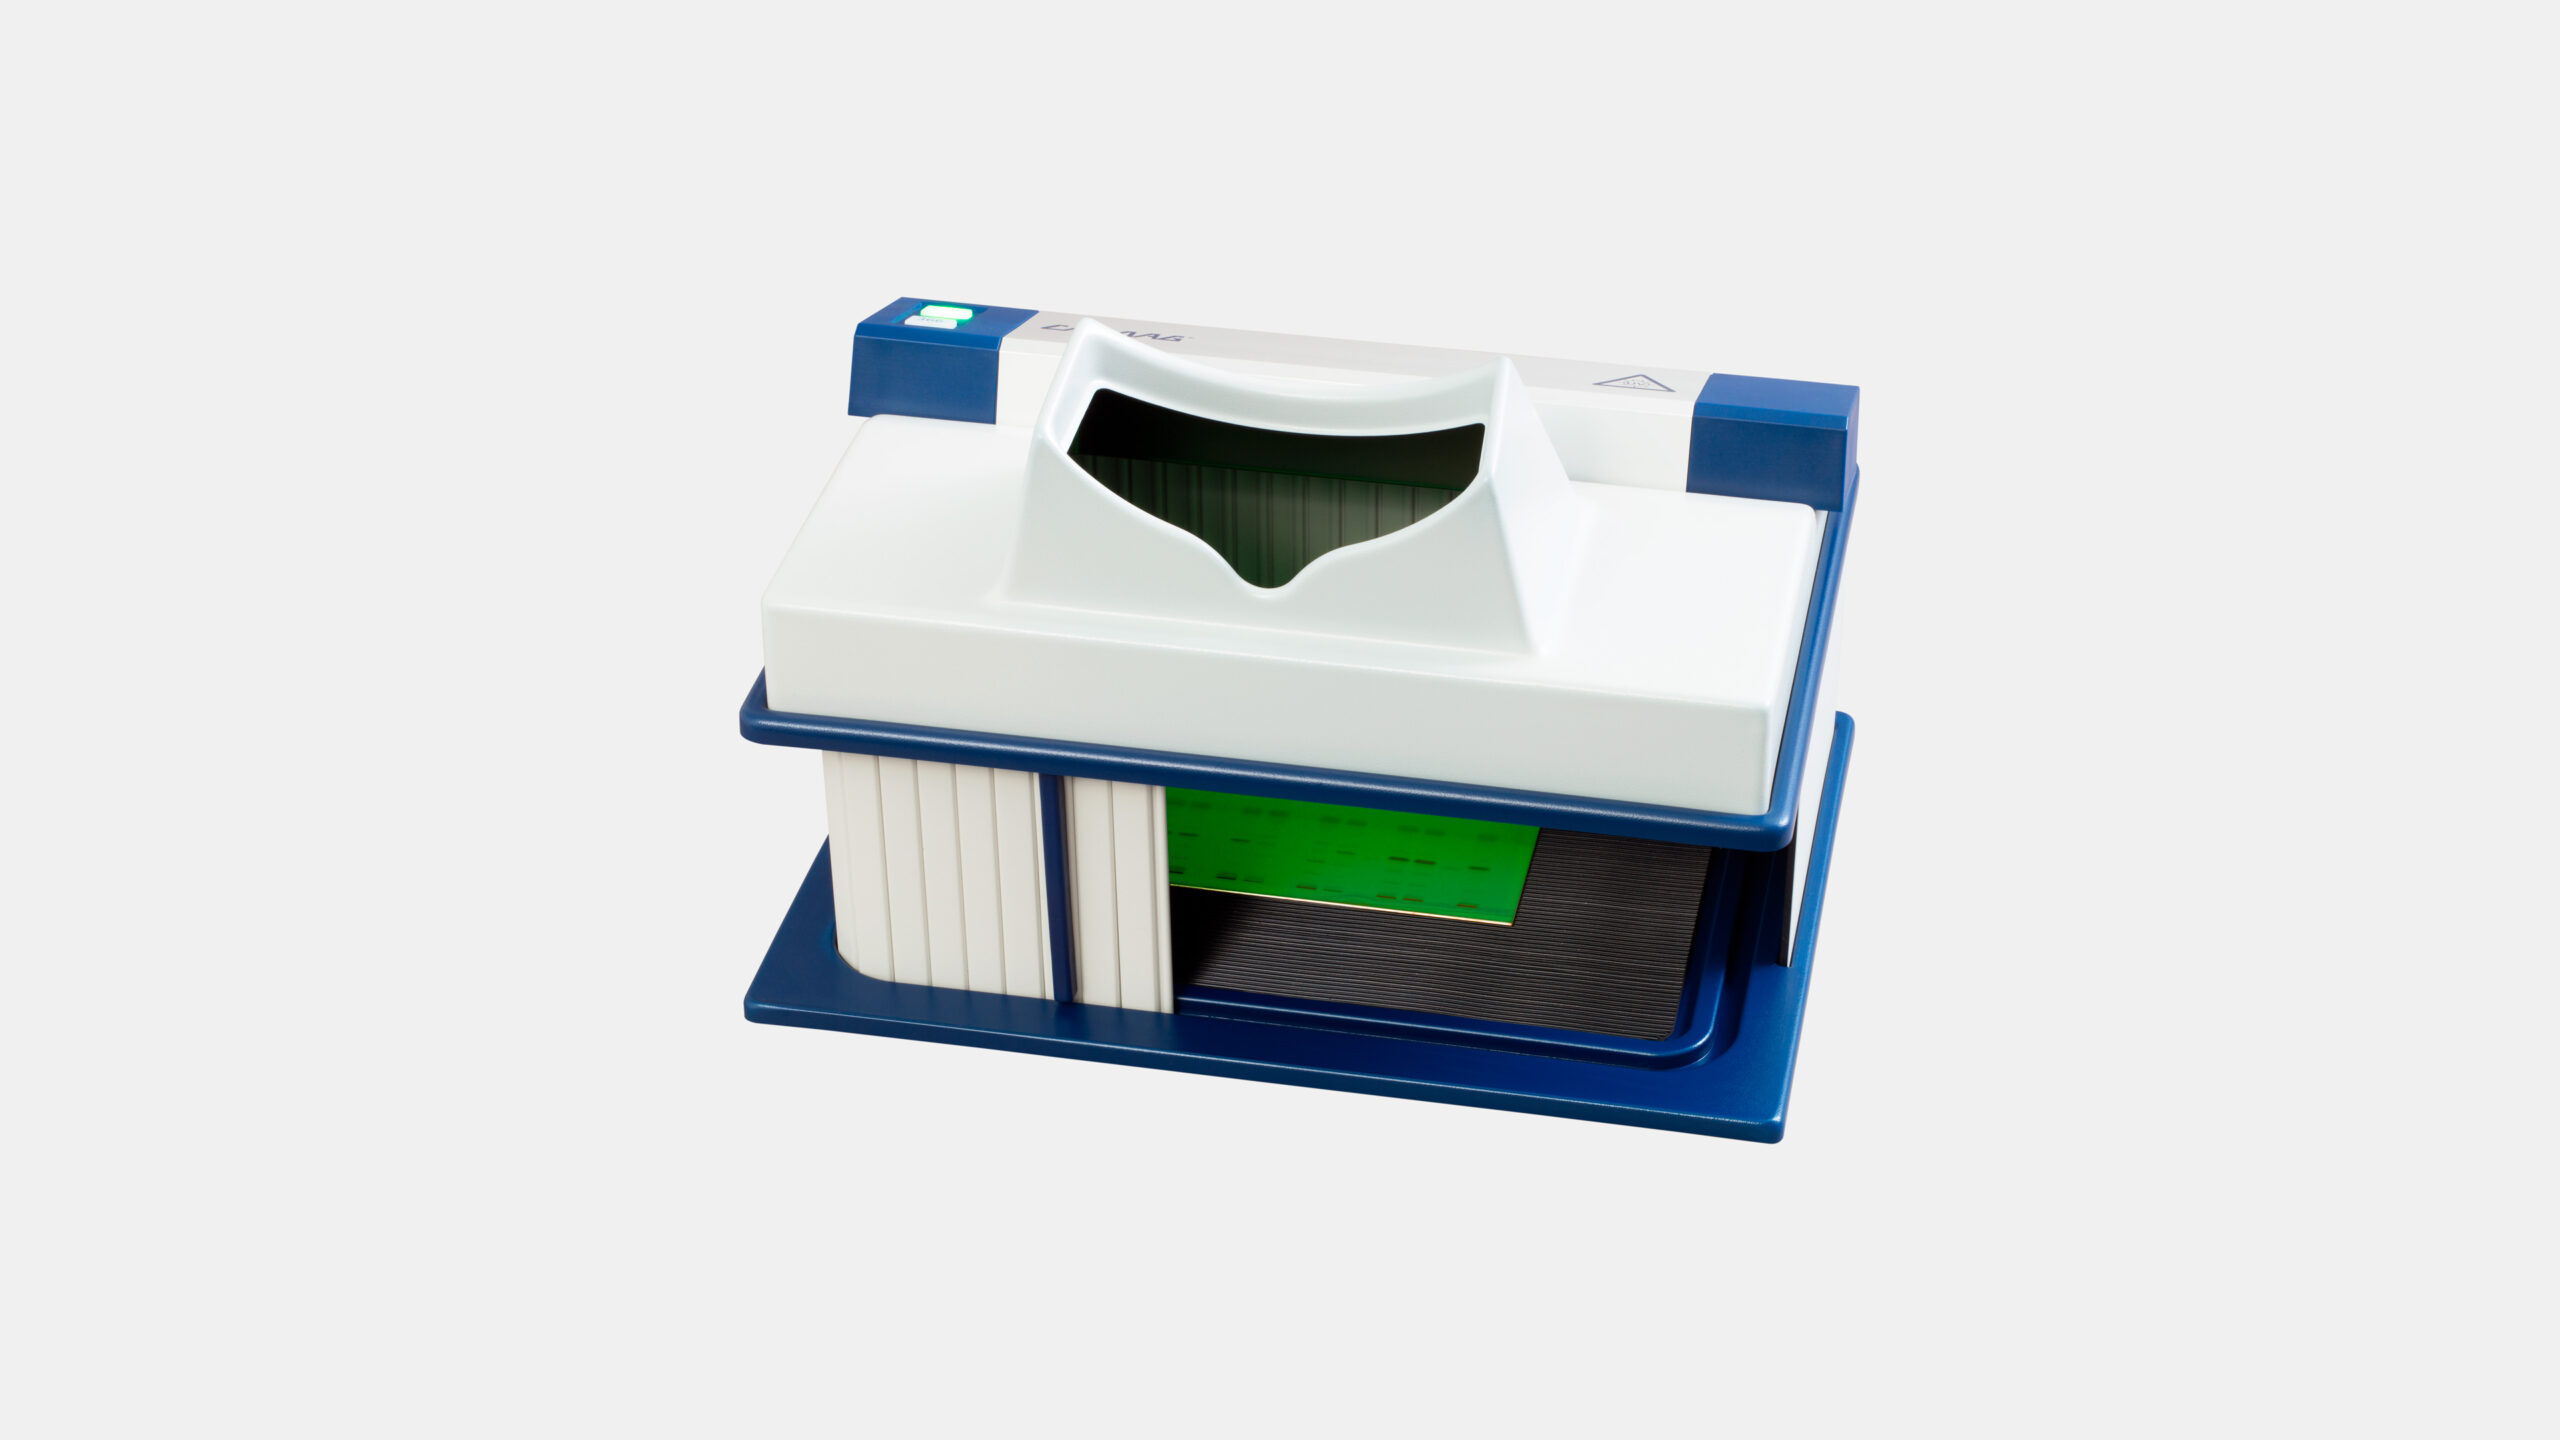
Figure 3: CAMAG® UV Cabinet 4
CAMAG® BioLuminizer® 2
The BioLuminizer® 2 is a detection system specifically designed to detect bioluminescence on HPTLC plates. The system consists of a compartment excluding any extraneous light, climate controlled for extended stability of the plate, and a 16 bit CCD digital camera of high-resolution and high-quantum efficiency. Hyphenating HPTLC and bioassay is an excellent tool for identification of single toxic compounds in complex sample matrices. The method is suitable for the detection of toxins in foodstuff, beverages, cosmetics, wastewater, drinking water, and for the detection of bioactivity in natural products. After chromatographic separation of the complex sample, the plate is immersed in a suspension of bioluminescent bacteria Allivibrio fischeri. The reaction takes place within a very short time. All zones with inhibitory or toxic effects appear as dark zones on the luminescent plate background. This stand-alone detection system is operated with BioLuminizer® 2 software.
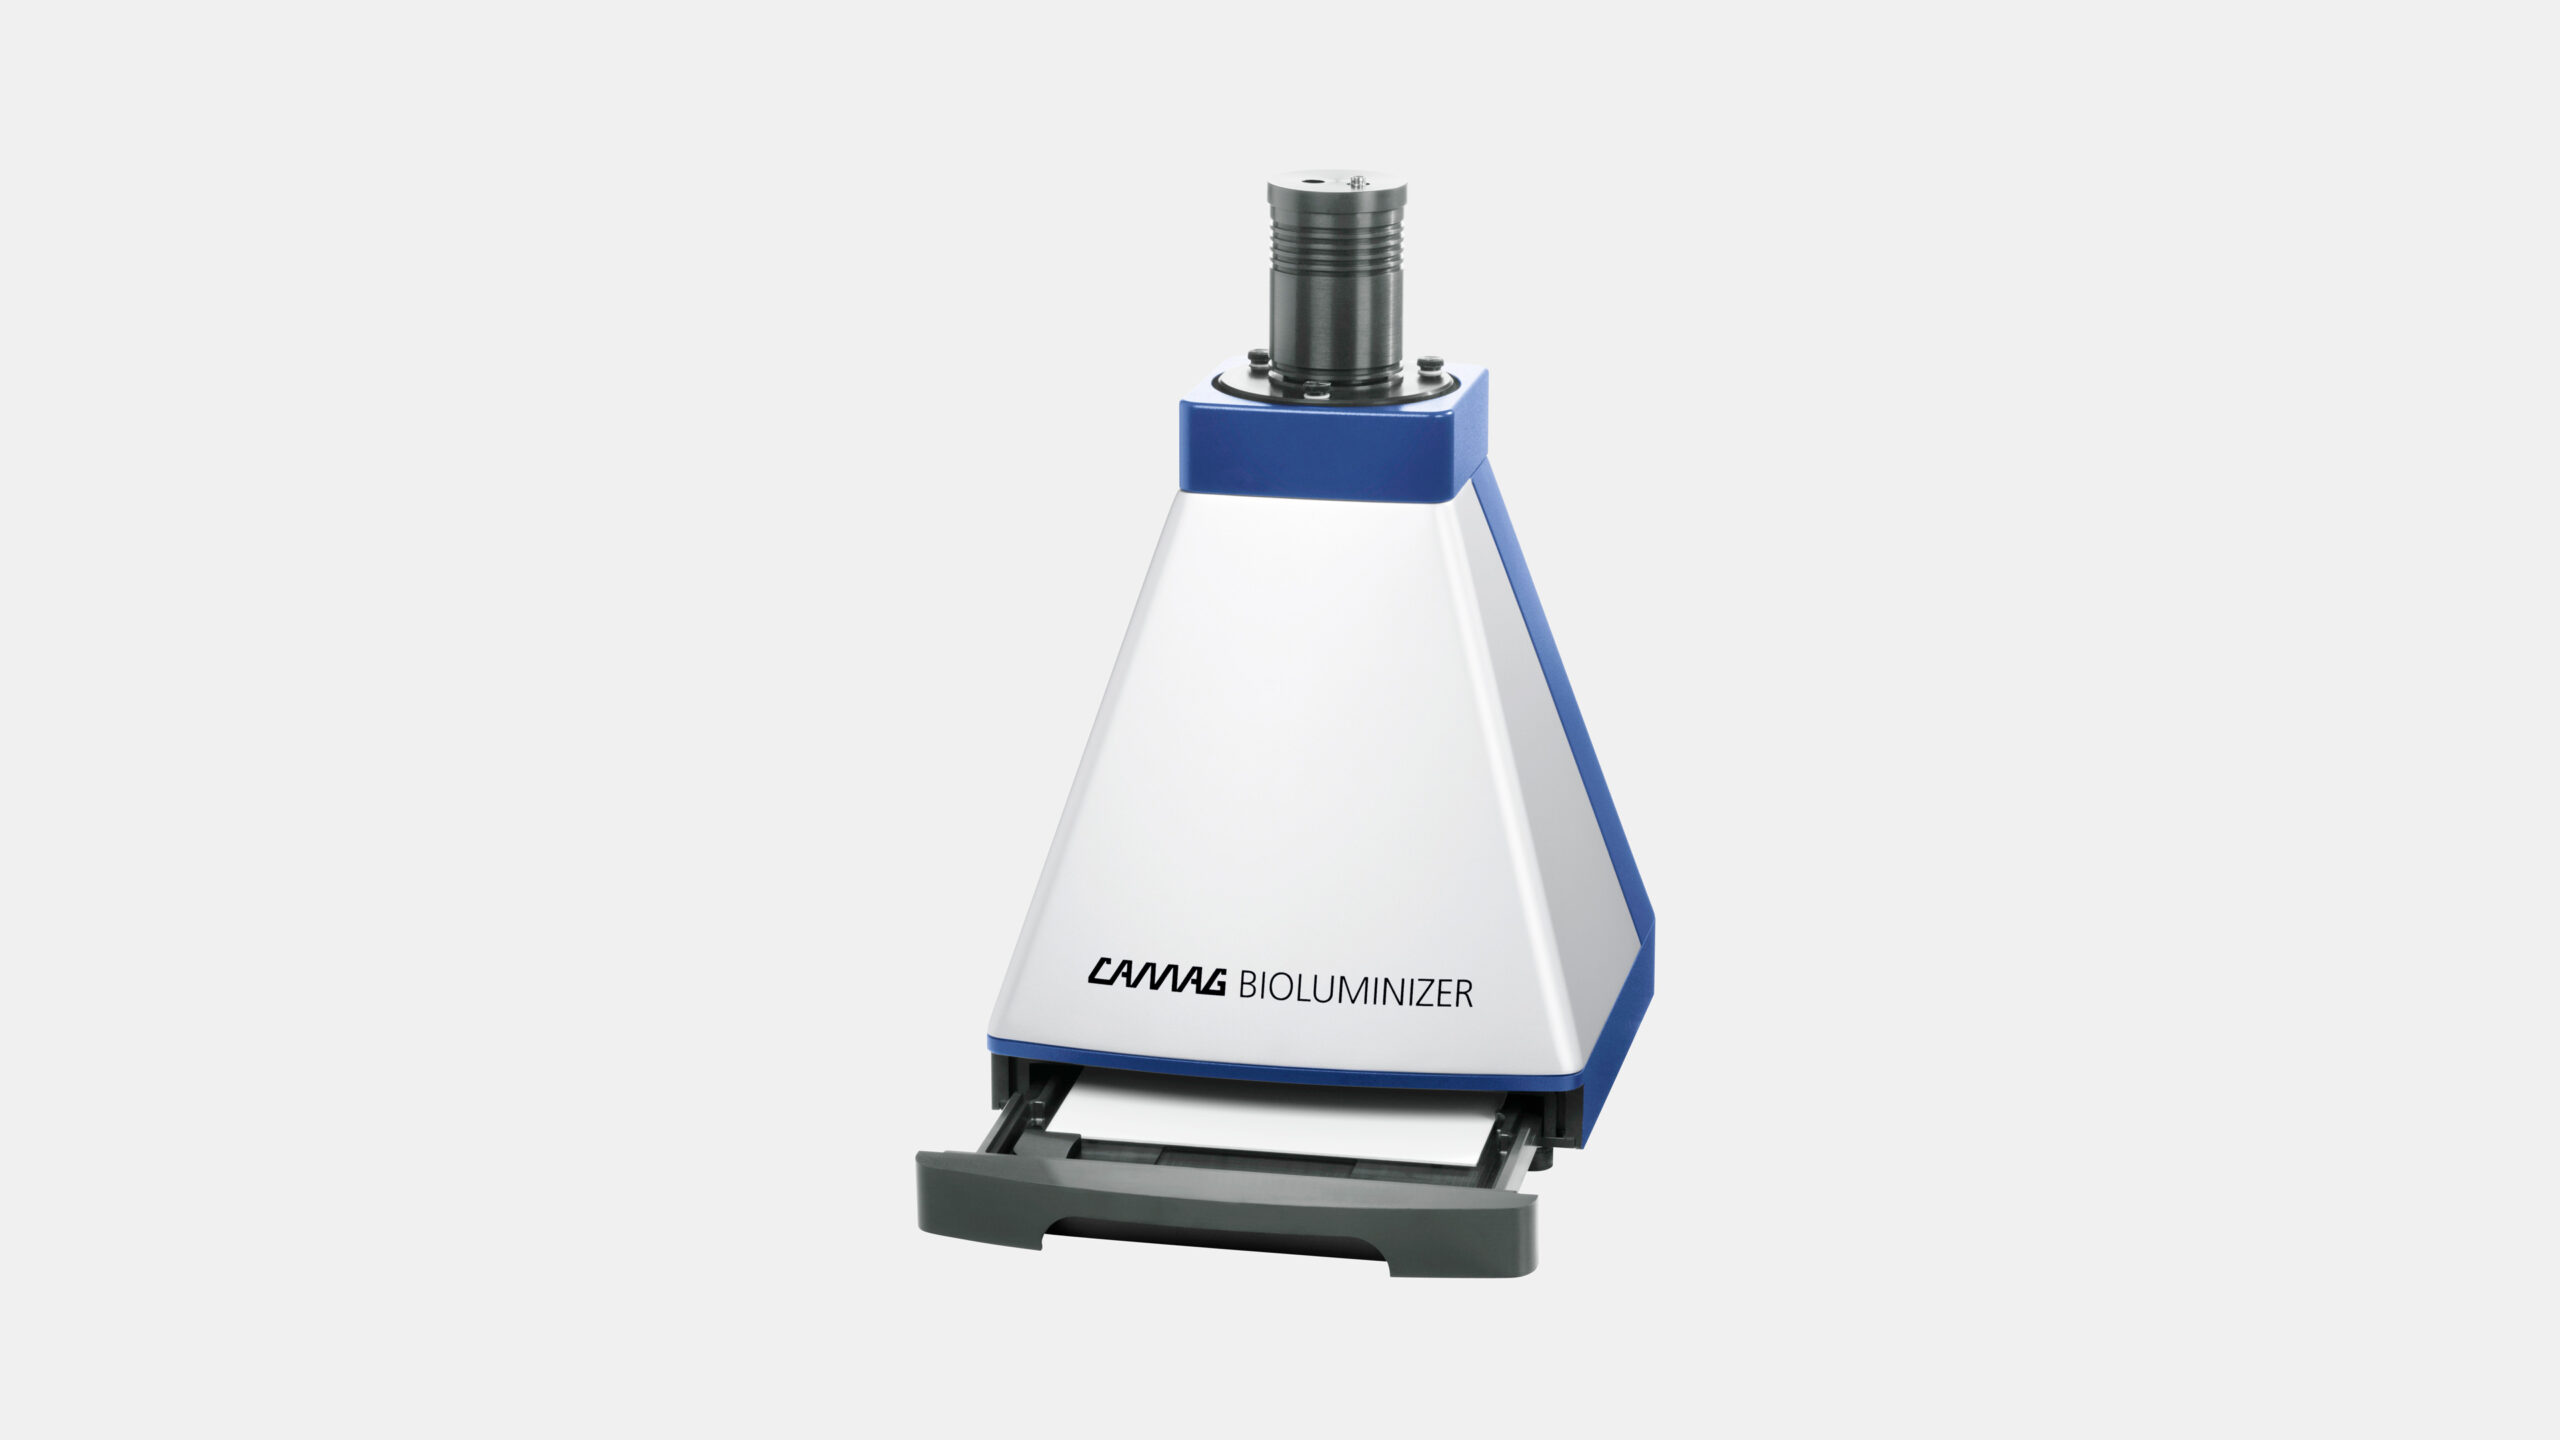
Figure 4: CAMAG® BioLuminizer® 2
Derivatization
The possibility of convenient chemical derivatization of substances separated on the plate is a strong advantage of planar chromatographic techniques. There are specific and non-specific reagents. An extensive list of reagents and their targeted groups can be found in the two-volume collection “Thin-Layer Chromatography: Reagents and Detection Methods” [1] [2]. It is possible, in some cases, to use subsequently a specific reagent and a universal reagent on the same plate. For example, the first derivatization with natural products reagent (2-aminoethyl diphenylborinate), specific for phenolic compounds like flavonoids, can be followed with anisaldehyde reagent, which is rather universal.
Reagent Transfer onto the Plate
Most derivatization reagents are solutions that are sprayed onto the developed plate or into which the plate is dipped. In a few cases, the reagent is a gas that can be generated, e.g. in the rear trough of a TTC (ammonia or HCl from the respective aqueous solution, iodine from iodine crystals), while the plate is in the empty front trough of the chamber.
-
Automated spraying: It takes advantage of dedicated instruments, which control the transferred volume of reagent and minimize the release of fumes. About 2-3 mL of reagent are typically used for a standard HPTLC plate. A wide range of reagents is compatible with this technique.
-
Manual spraying: Is a quick, inexpensive and universally applicable method of reagent transfer, performed with a simple glass apparatus and a hand-held rubber ball pump or compressed air. The principal drawbacks are the considerable skills required to achieve homogenous and reproducible results and the generation of toxic fumes.
-
Automated dipping/immersion: Utilizes an immersion device to achieve a very homogenous and reproducible reagent transfer. Rather large volumes of reagent (up to 200 mL), which can be re-used a couple of times, are provided in a dipping tank. The stability of reagents and possible contamination during possible re-use must be considered as well as changes in the concentration.
The preparation of reagents for dipping and spraying may be different. Dipping may require reduced reagent concentration and solvent adaptation to avoid washing off the separated samples during immersion.
Completion of the Derivatization
The majority of the chemical reactions require heating of the plate in an oven or on a hot plate (plate heater). For reproducible results, the temperature and duration of heating must be controlled. Proper timing is required for documentation of the result of the derivatization because colors obtained in the process may change or fade with time and temperature.
-
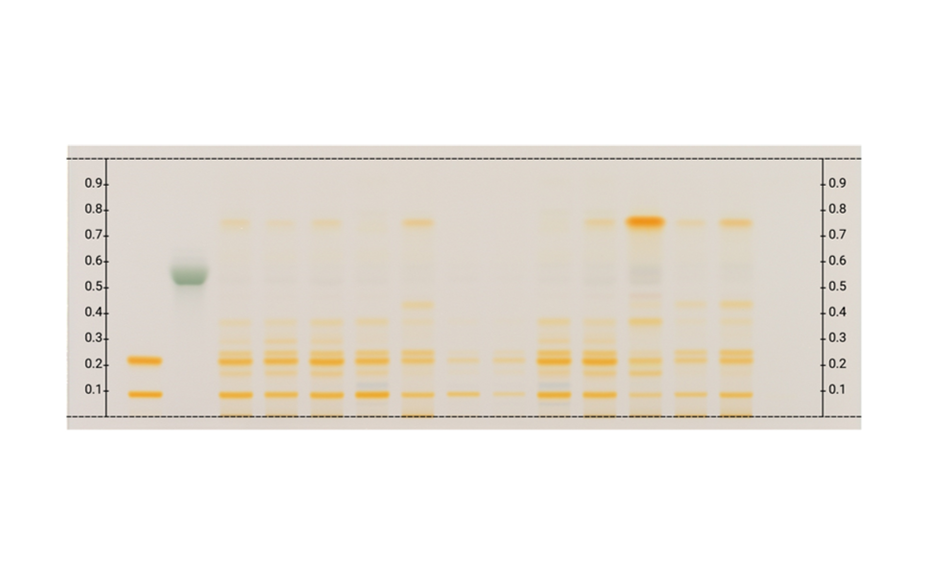
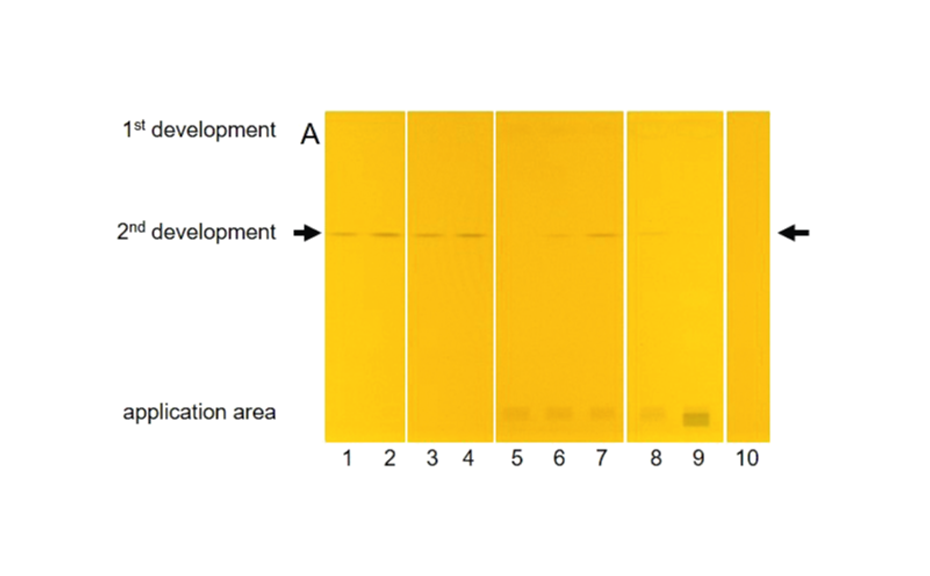
Figure 5a: Image of chromatogram in white light after derivatization
-
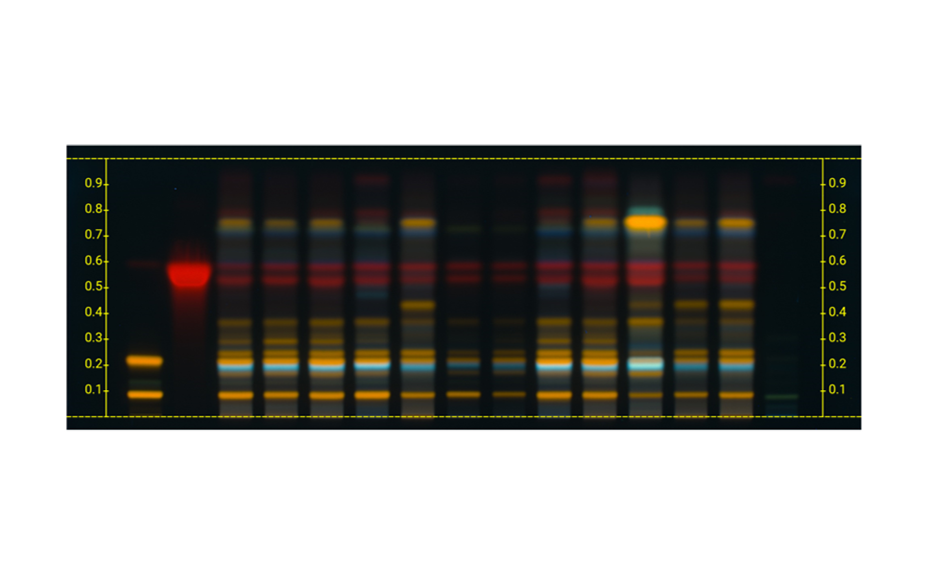
Figure 5b: Image of chromatogram in long-wave UV light 366 nm after derivatization
Instrumentation
CAMAG® HPTLC PRO Module DERIVATIZATION
The degree of automation and productivity are key factors for the HPTLC laboratory. The Module DERIVATIZATION is part of the HPTLC PRO SYSTEM, a fully automated sample analysis and evaluation system using HPTLC plates (20 x 10 cm), which is best suited for routine quality control of analytes, extracted from complex matrices and provides reproducible and reliable results.
Designed for the fully automatic derivatization of HPTLC glass plates (20 x 10 cm), the Module DERIVATIZATION combines two steps in a single device: high-precision spraying of derivatization reagents and heating of the plate. Employing the patented micro-droplet spraying technology, the Module DERIVATIZATION enables maximum homogeneity in applying derivatization reagents. The integrated plate heating unit ensures a uniform heat distribution across the plate.
To suit the viscosity of the spraying reagents, three different nozzles are available. Equipped with a fully automated nozzle changer and cleaning station, the Module DERIVATIZATION effectively avoids cross-contamination.
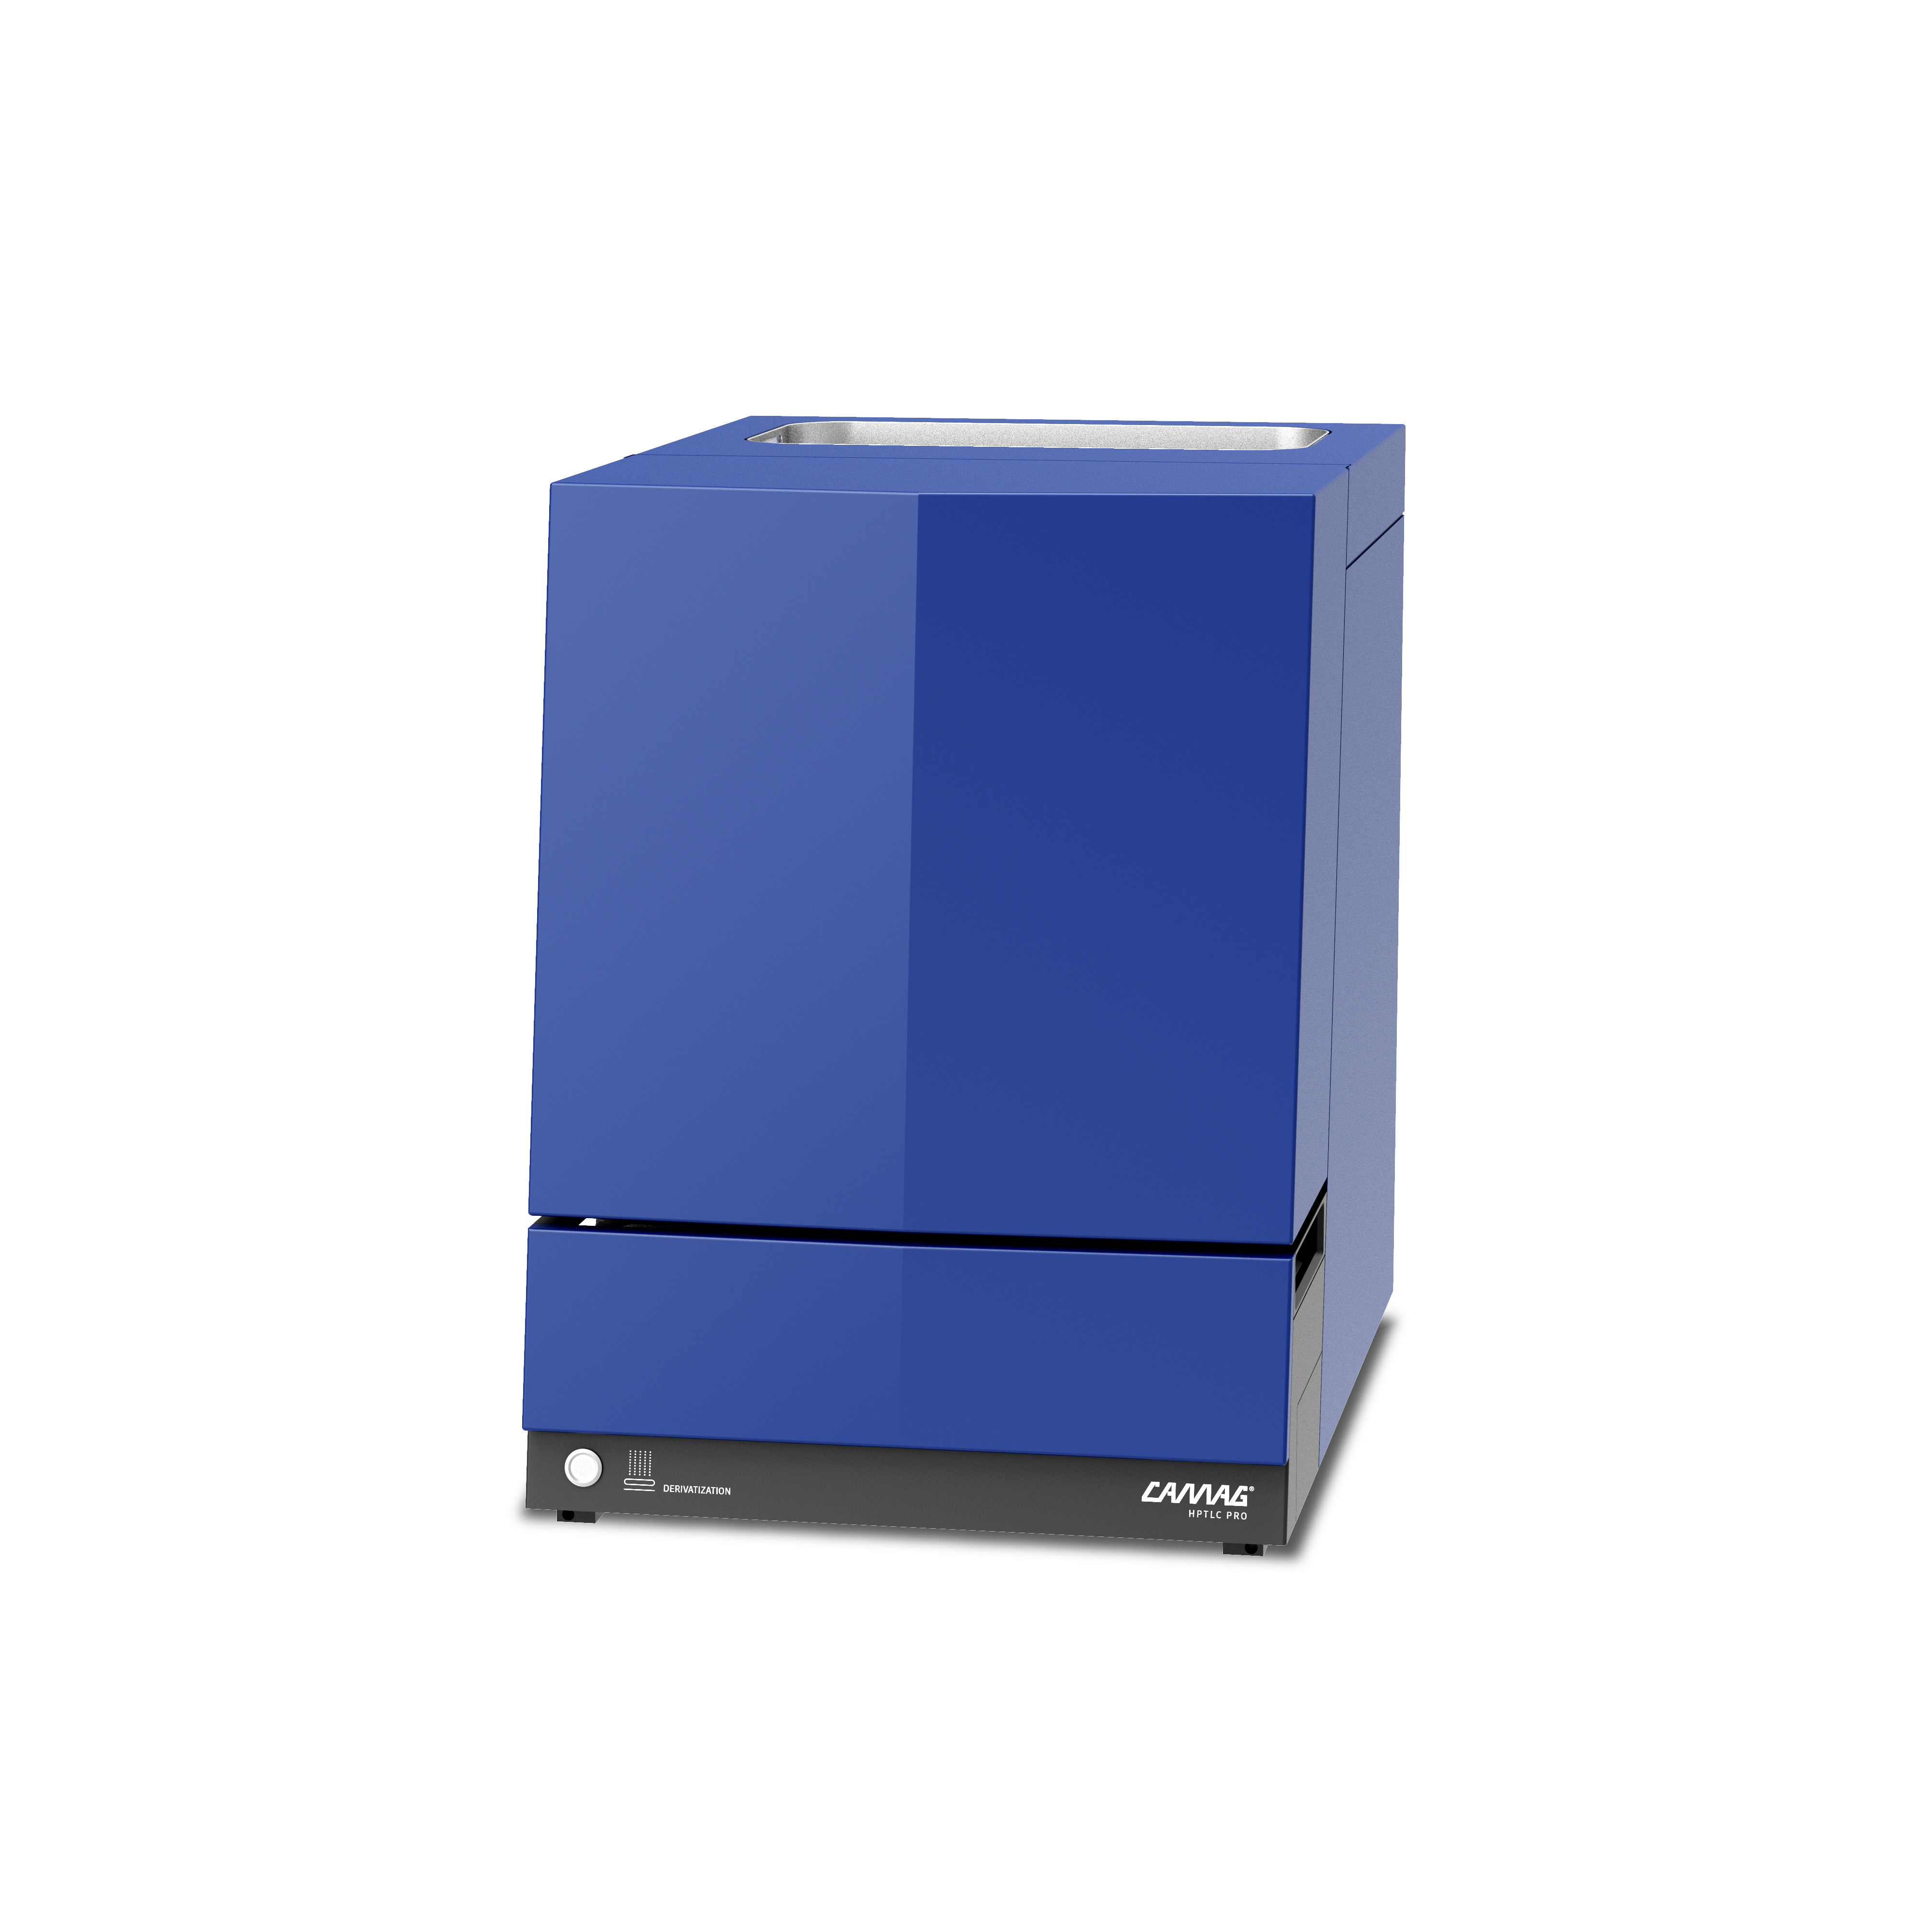
Figure 6: CAMAG® HPTLC PRO Module DERIVATIZATION
CAMAG® Derivatizer
Designed for automated reagent transfer onto HPTLC plates, the Derivatizer ensures highest reproducibility and safe handling. Employing the patented micro-droplet spraying technology, the Derivatizer guarantees unsurpassed homogeneous reagent distribution at low consumption. The stand-alone device enables reproducible and user-independent results and is suitable for a wide range of spraying reagents.
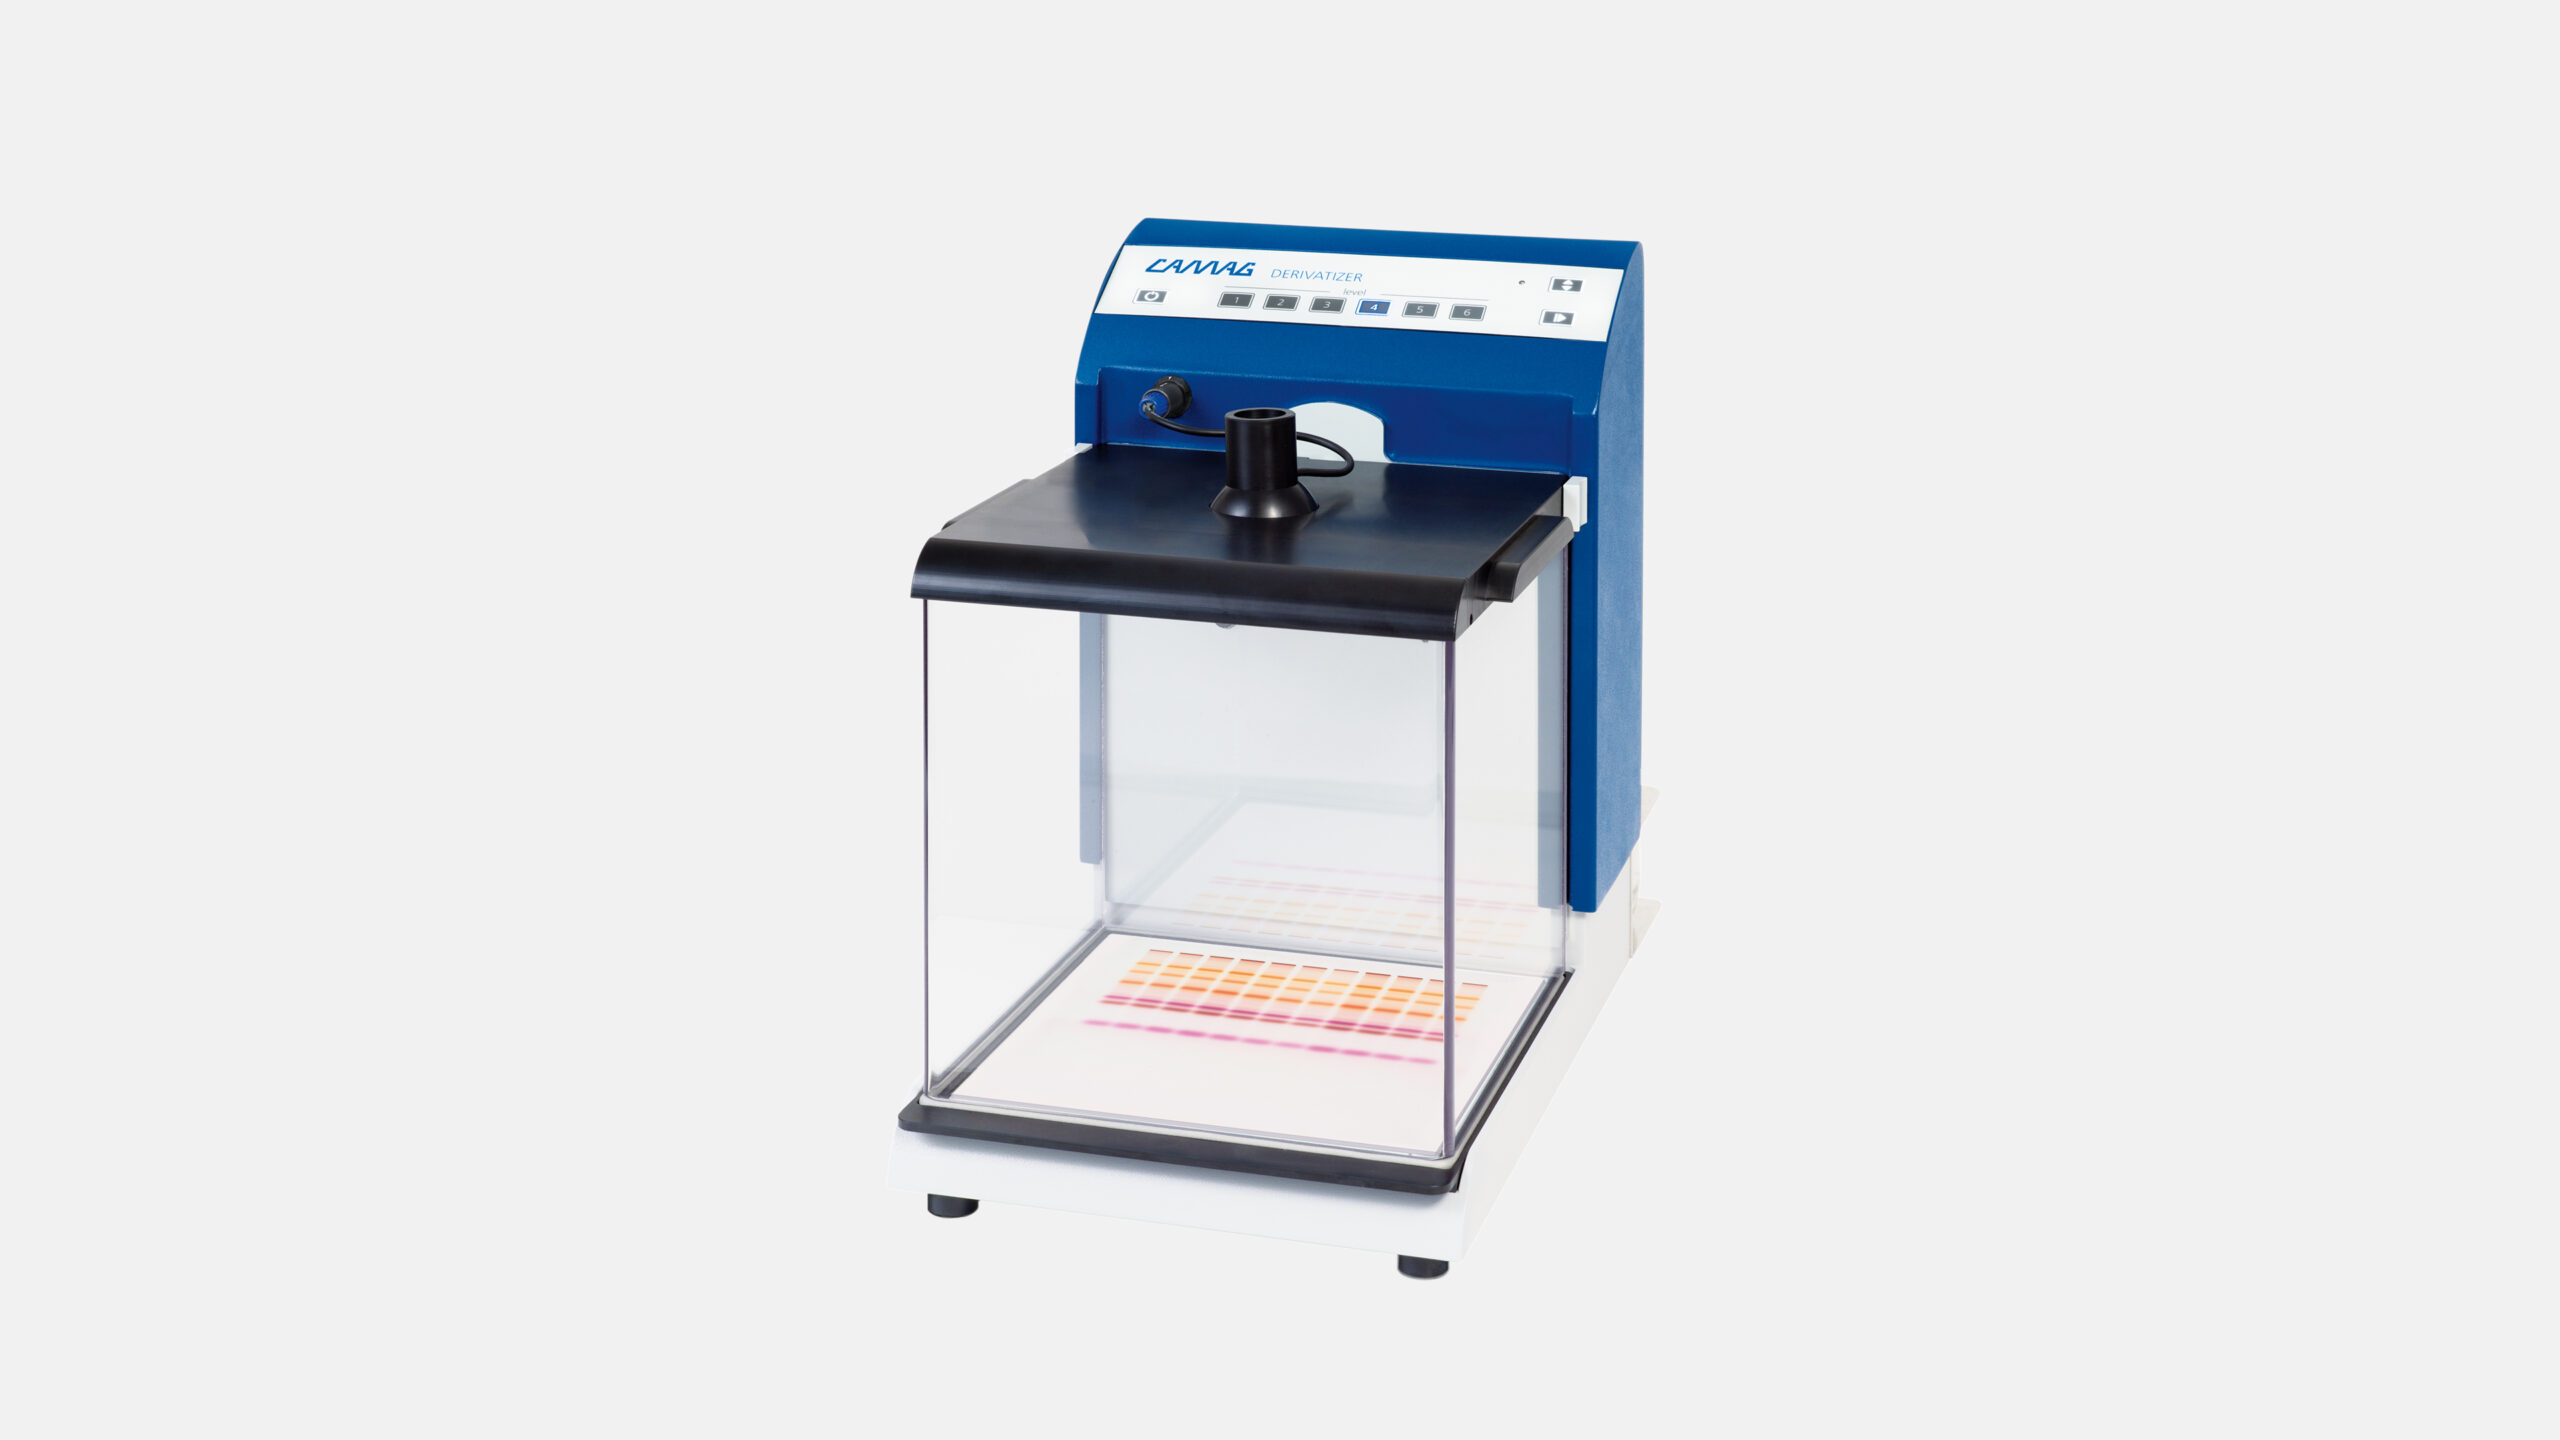
Figure 7: CAMAG® Derivatizer
CAMAG® TLC Plate Heater 3
The TLC Plate Heater 3 is a device for heating HPTLC plates, permitting the optimal heating during the derivatization reaction. It features a NEXTREMA® heating surface, which is resistant to all common reagents and is easily cleaned. The heating surface has a grid to facilitate correct positioning of the plate. The temperature is selectable between 25 and 200 °C, the programmed and the actual temperature are displayed.
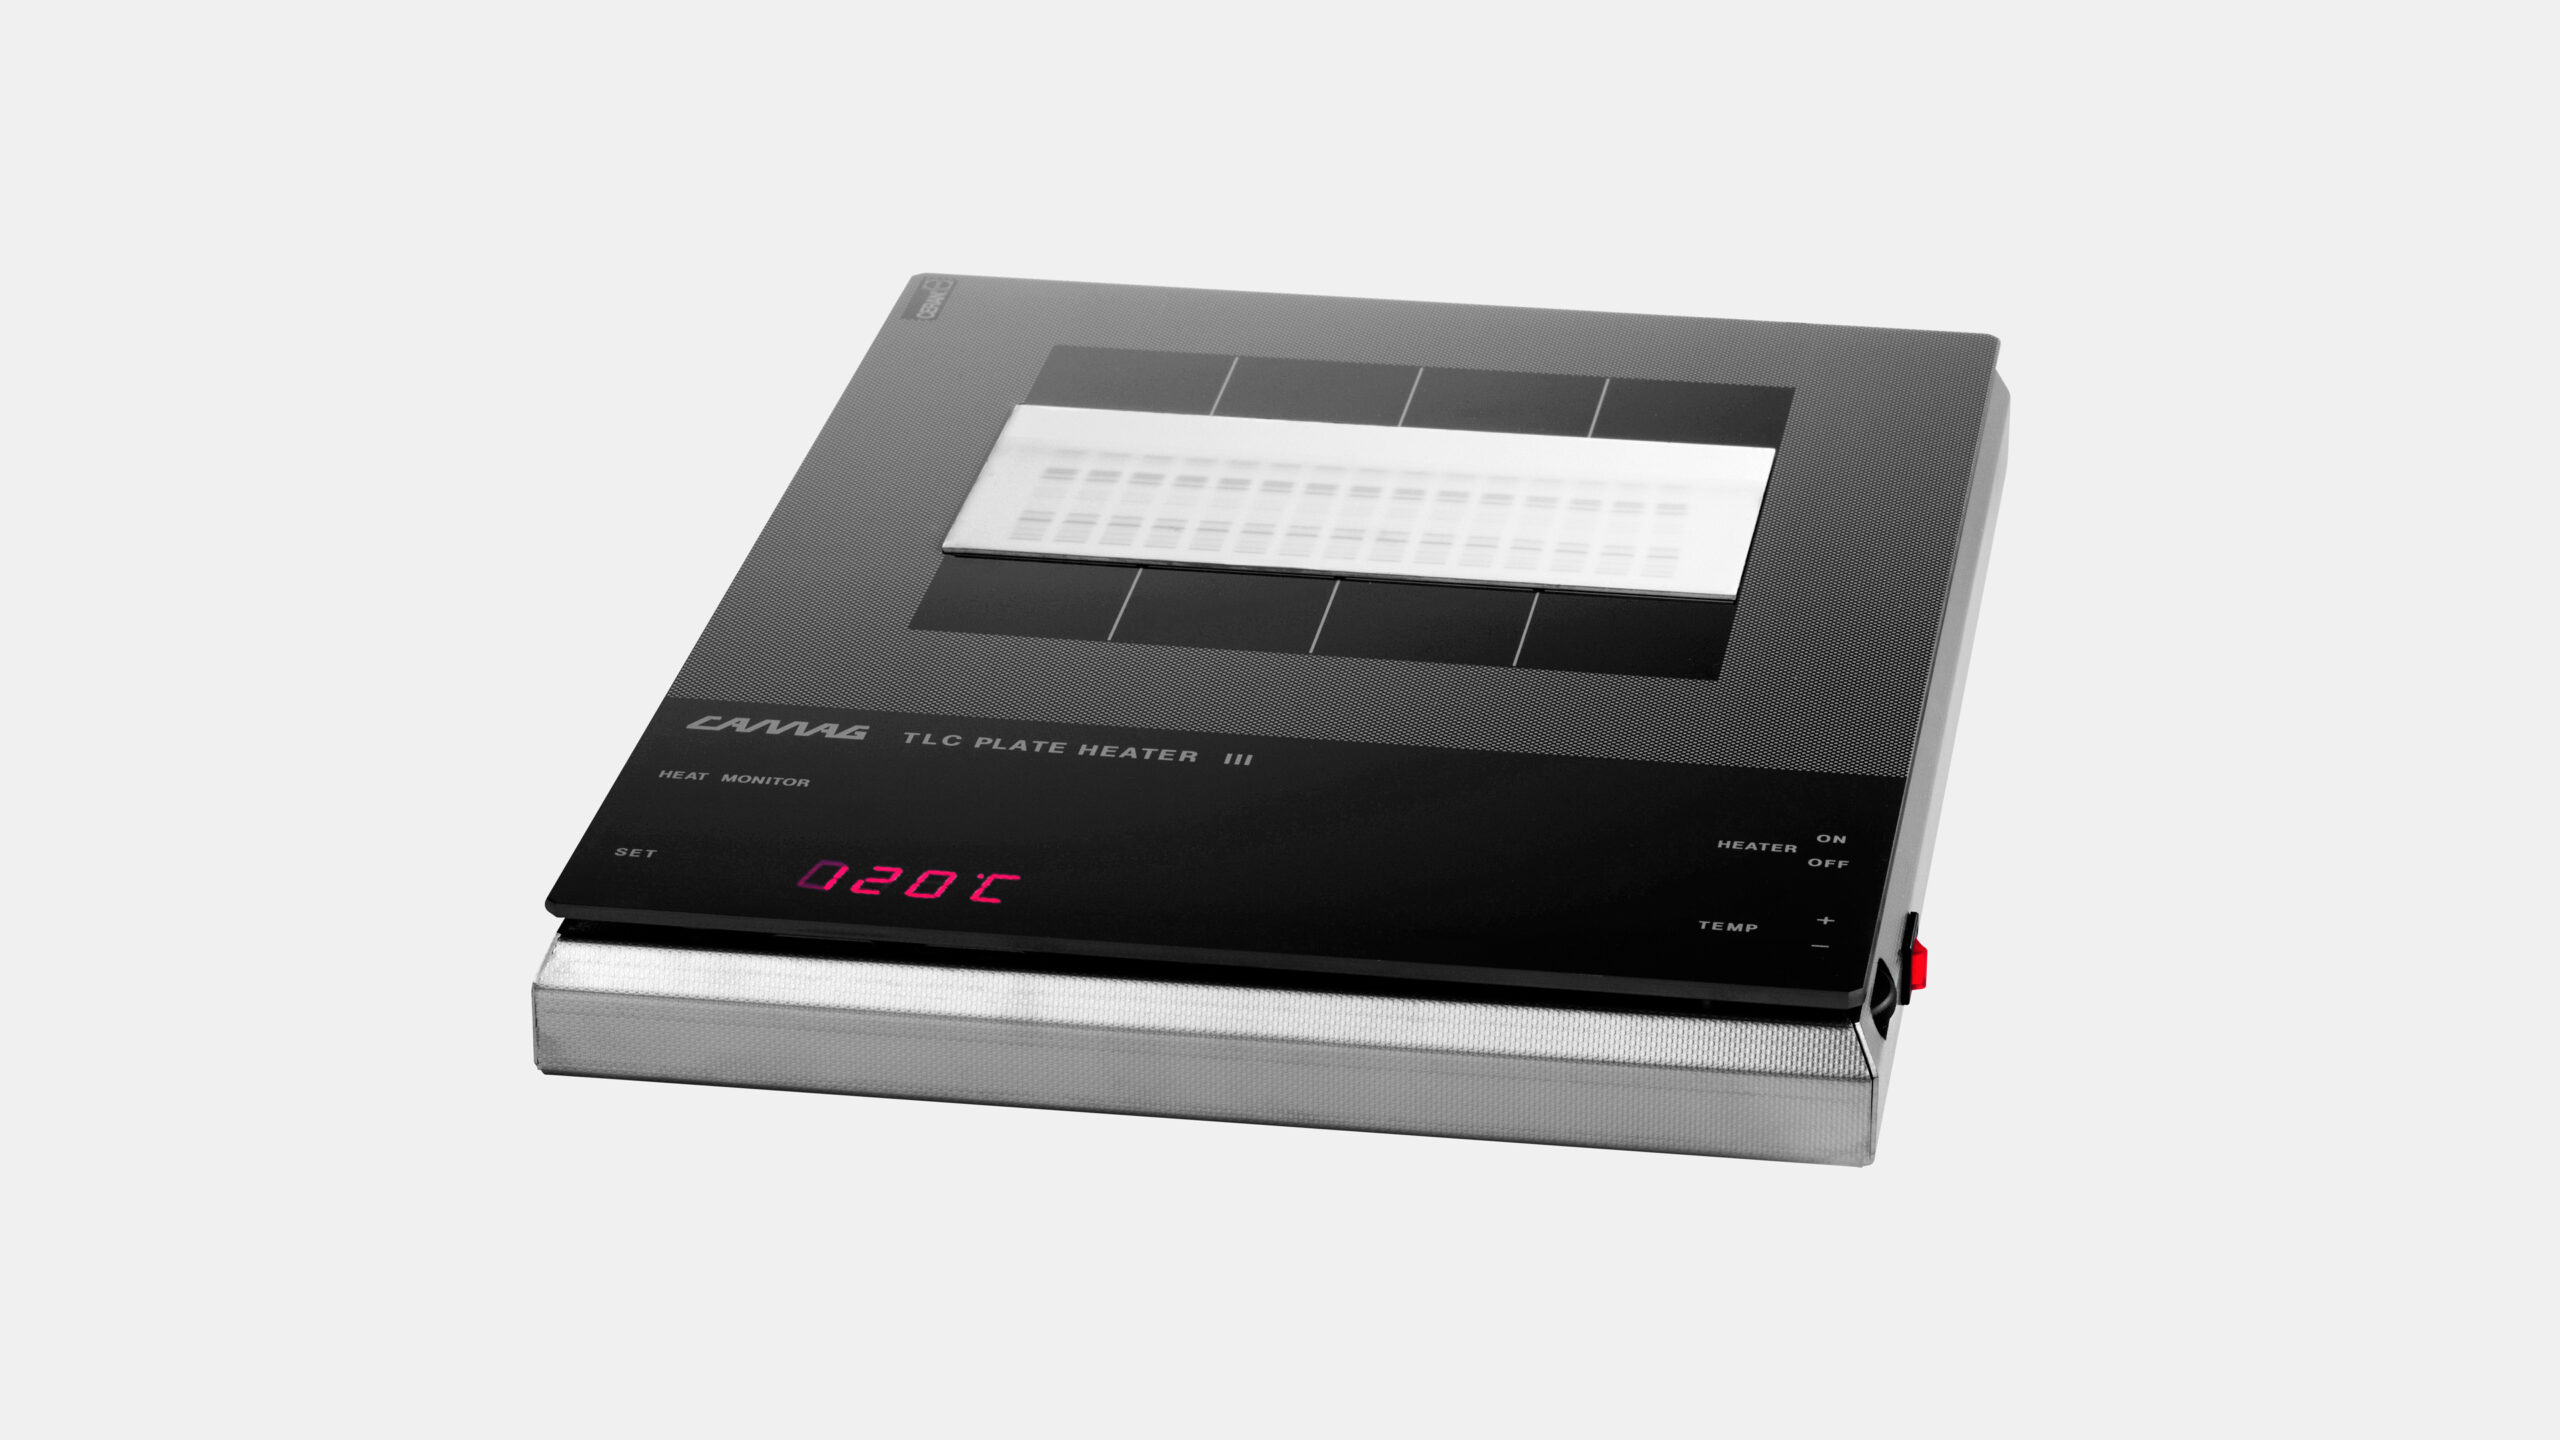
Figure 8: CAMAG® TLC Plate Heater 3
Densitometry
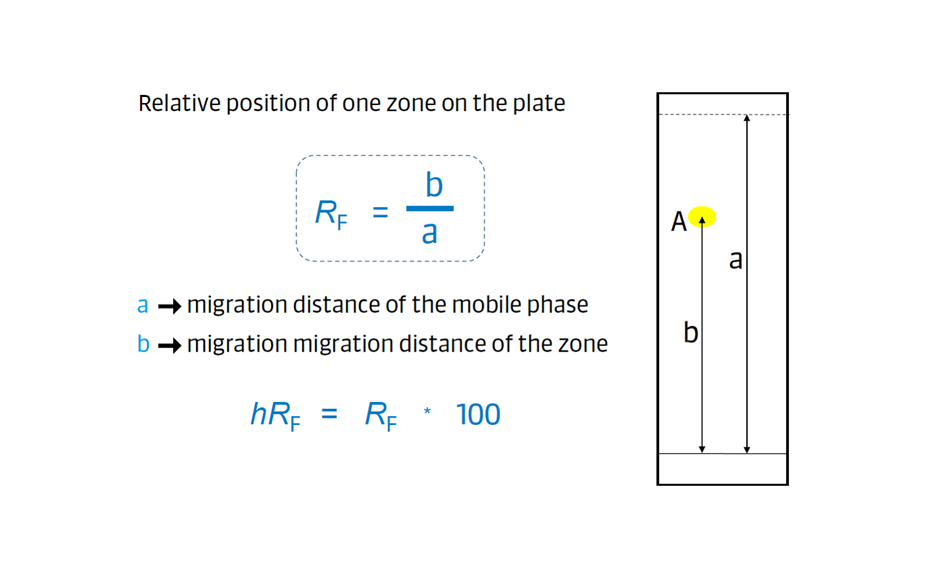
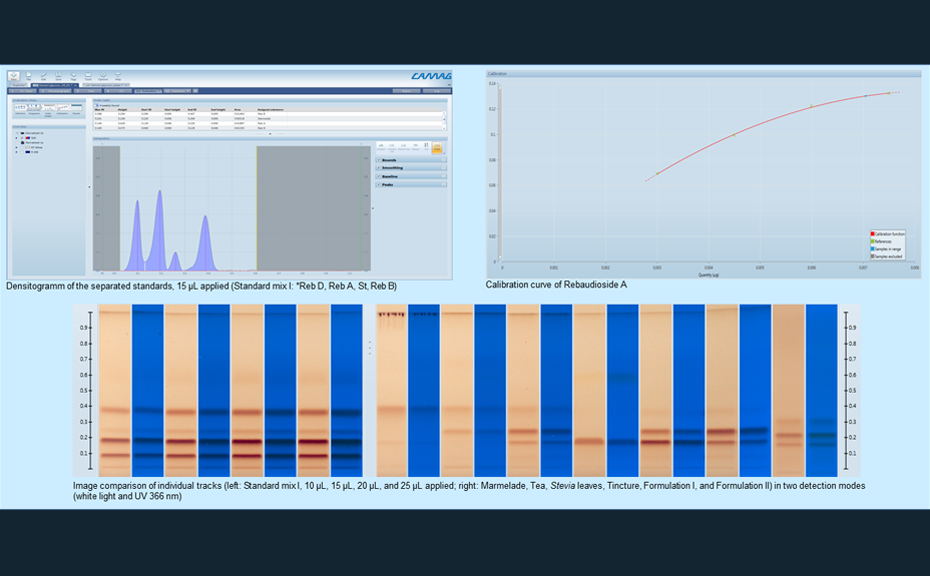
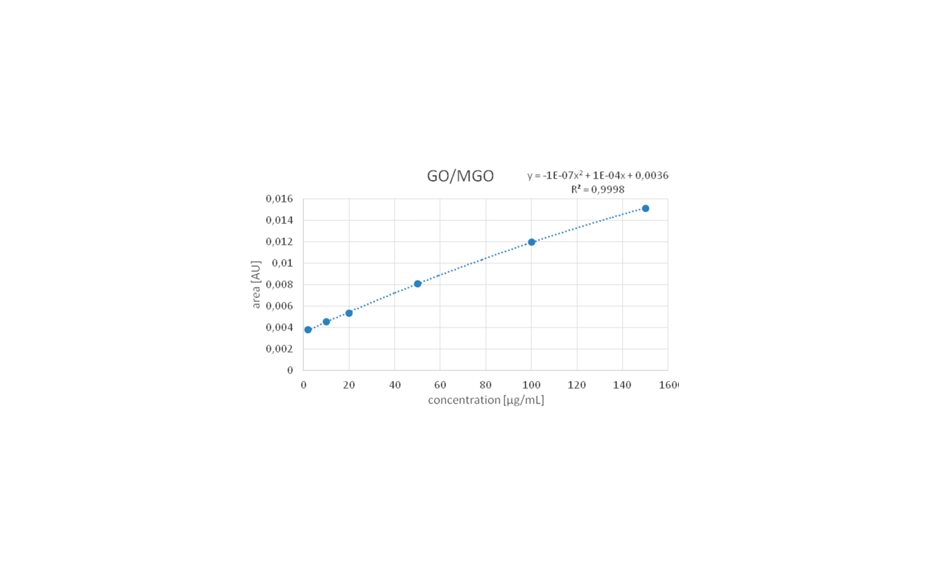
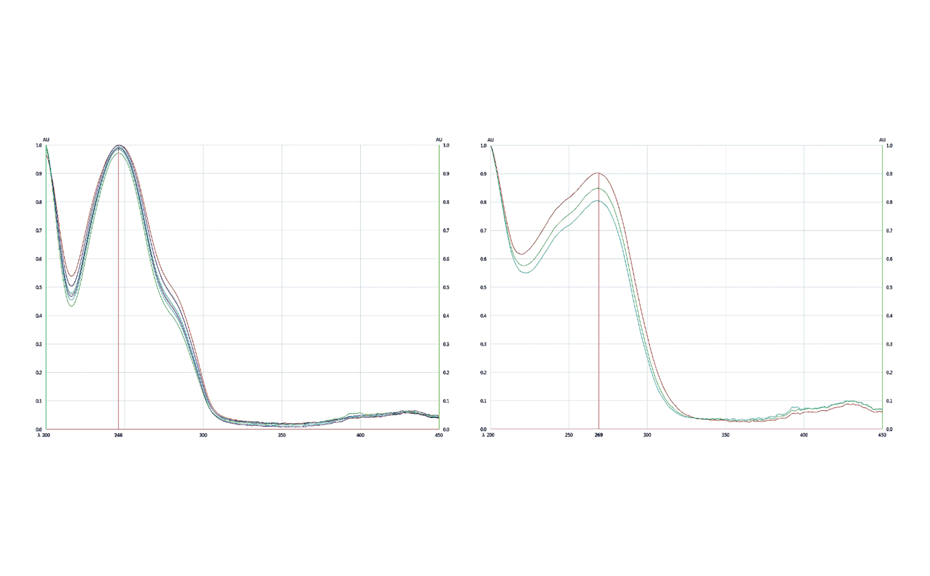
HPTLC chromatograms can be recorded with scanning densitometry showing peaks of the separated compounds. In a densitometer, a vertical beam of monochromatic light between 190-900 nm moves along the individual tracks of the plate. Part of that light is reflected from the plate and measured by a detector. The obtained signal is processed and plotted as a function of position (RF), generating the densitogram or Peak Profile from Scanning Densitometry (PPSD) used for qualitative and quantitative evaluation.
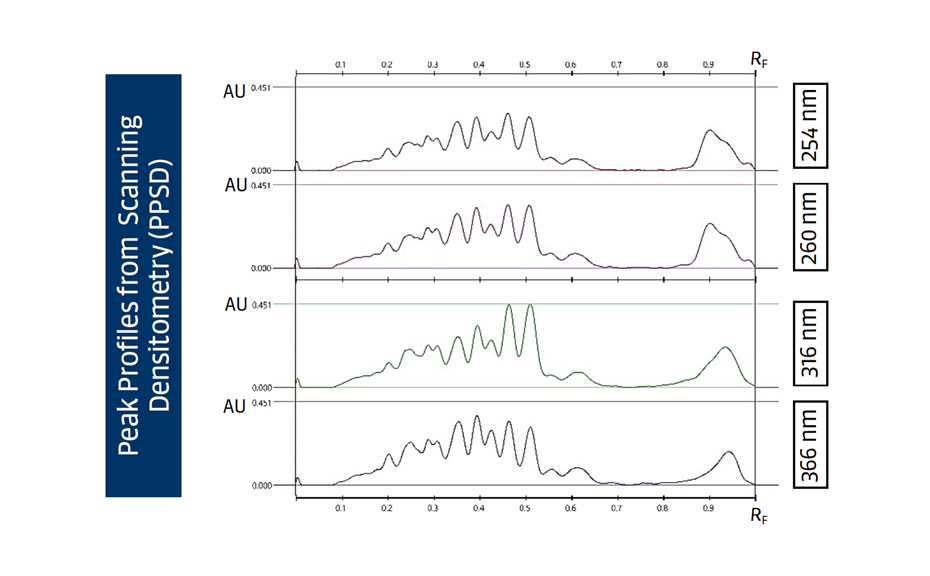
Figure 9: Densitograms measured at different wavelengths
Modern scanning densitometers allow measurements in two modes:
Absorbance mode: Measures the amount of light absorbed by the zones. The particles of the stationary phase reflect light (baseline). Zones present in the track can absorb part of that light lowering the signal received in the detector. For plotting the PPSD, the signal is typically inverted.
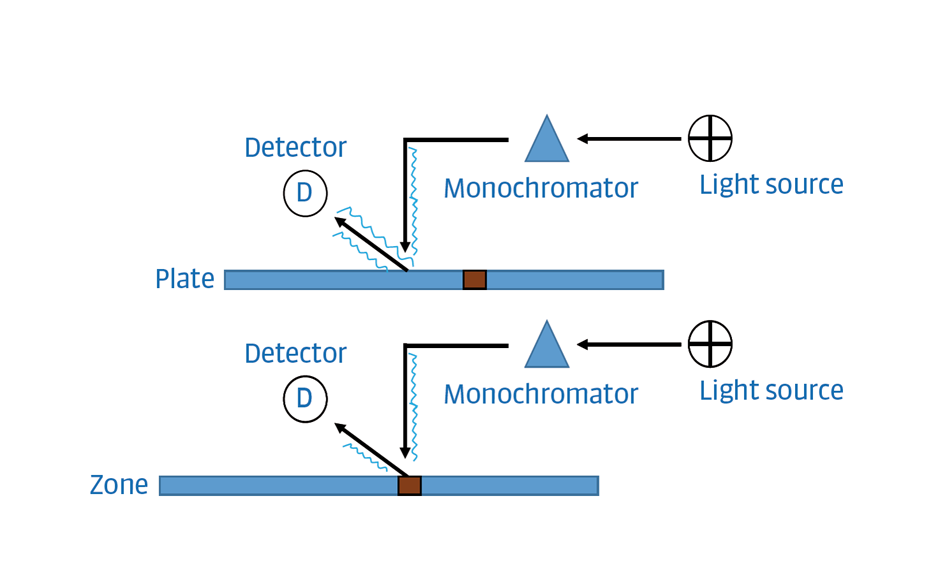
Figure 10: Simplified scheme of absorbance mode
Fluorescence mode: Measures the fluorescence of the zones excited at a specific wavelength. From a molecular point of view, fluorescence happens when a photon is absorbed, causing an electronic transition from the ground state to an excited state. When the molecule returns to its ground state, the energy is dissipated at a higher wavelength. To selectively detect the response, densitometers are usually equipped with a cut-off filter placed between the plate and the detector (yellow rectangle in the Figure 11). The cut-off filter blocks the reflected short wave light used for excitation so that only longer wavelengths can reach the detector (photomultiplier).
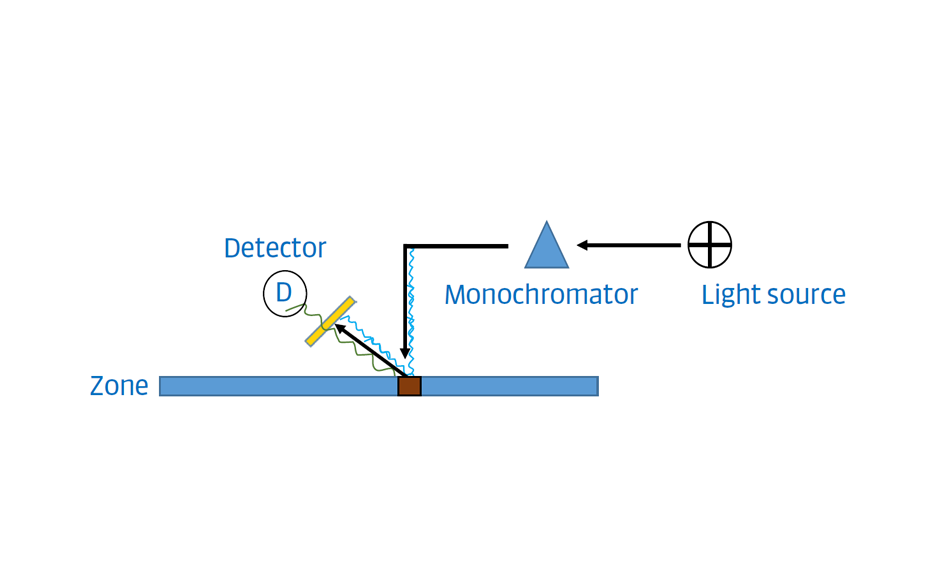
Figure 11: Simplified scheme of fluorescence mode
Fluorescence measurements are up to 100 times more sensitive than absorbance measurements and generally feature a straight baseline because the cut-off filter blocks reflected light from the plate. Only a few substances are naturally fluorescent. Fluorescence can be induced by chemical derivatization, however the fluorescence of zones is not always stable and might decrease over time. Commercial densitometers feature three light sources:
- Deuterium lamp
- Tungsten lamp
- Mercury lamp
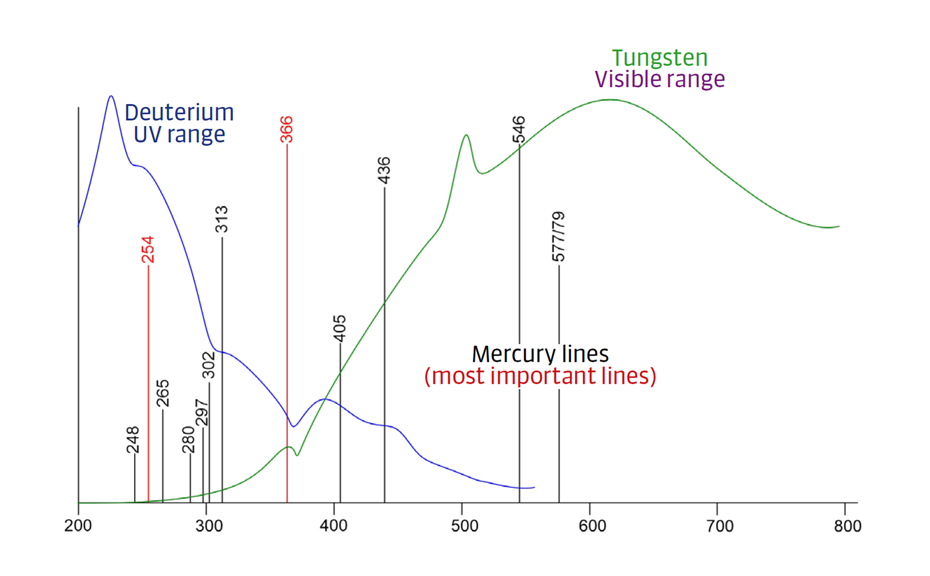
Figure 12: Emission spectra of commonly used light sources
Instrumentation
CAMAG® TLC Scanner 4
Designed for the densitometric evaluation of HPTLC chromatograms, the TLC Scanner 4 measures the reflection of separated compounds in absorption and/or fluorescence mode. The spectral range of light from 190 to 900 nm is available for selecting single or multiple wavelengths. Detection can thus be fine-tuned to match the spectral properties of the analyte to its optimized specificity and sensitivity of the detection. The visionCATS software controls the TLC Scanner 4 and enables quantitative evaluation of the generated densitometric data. To determine the substance concentration in a sample, five different quantification functions are available. Several scanning steps, e.g. scanning the plate after development and scanning the same plate after derivatization and up to five different evaluations can be performed with data obtained from single wavelength, multiple wavelengths or a combination of measurements in absorption and fluorescence detection mode.
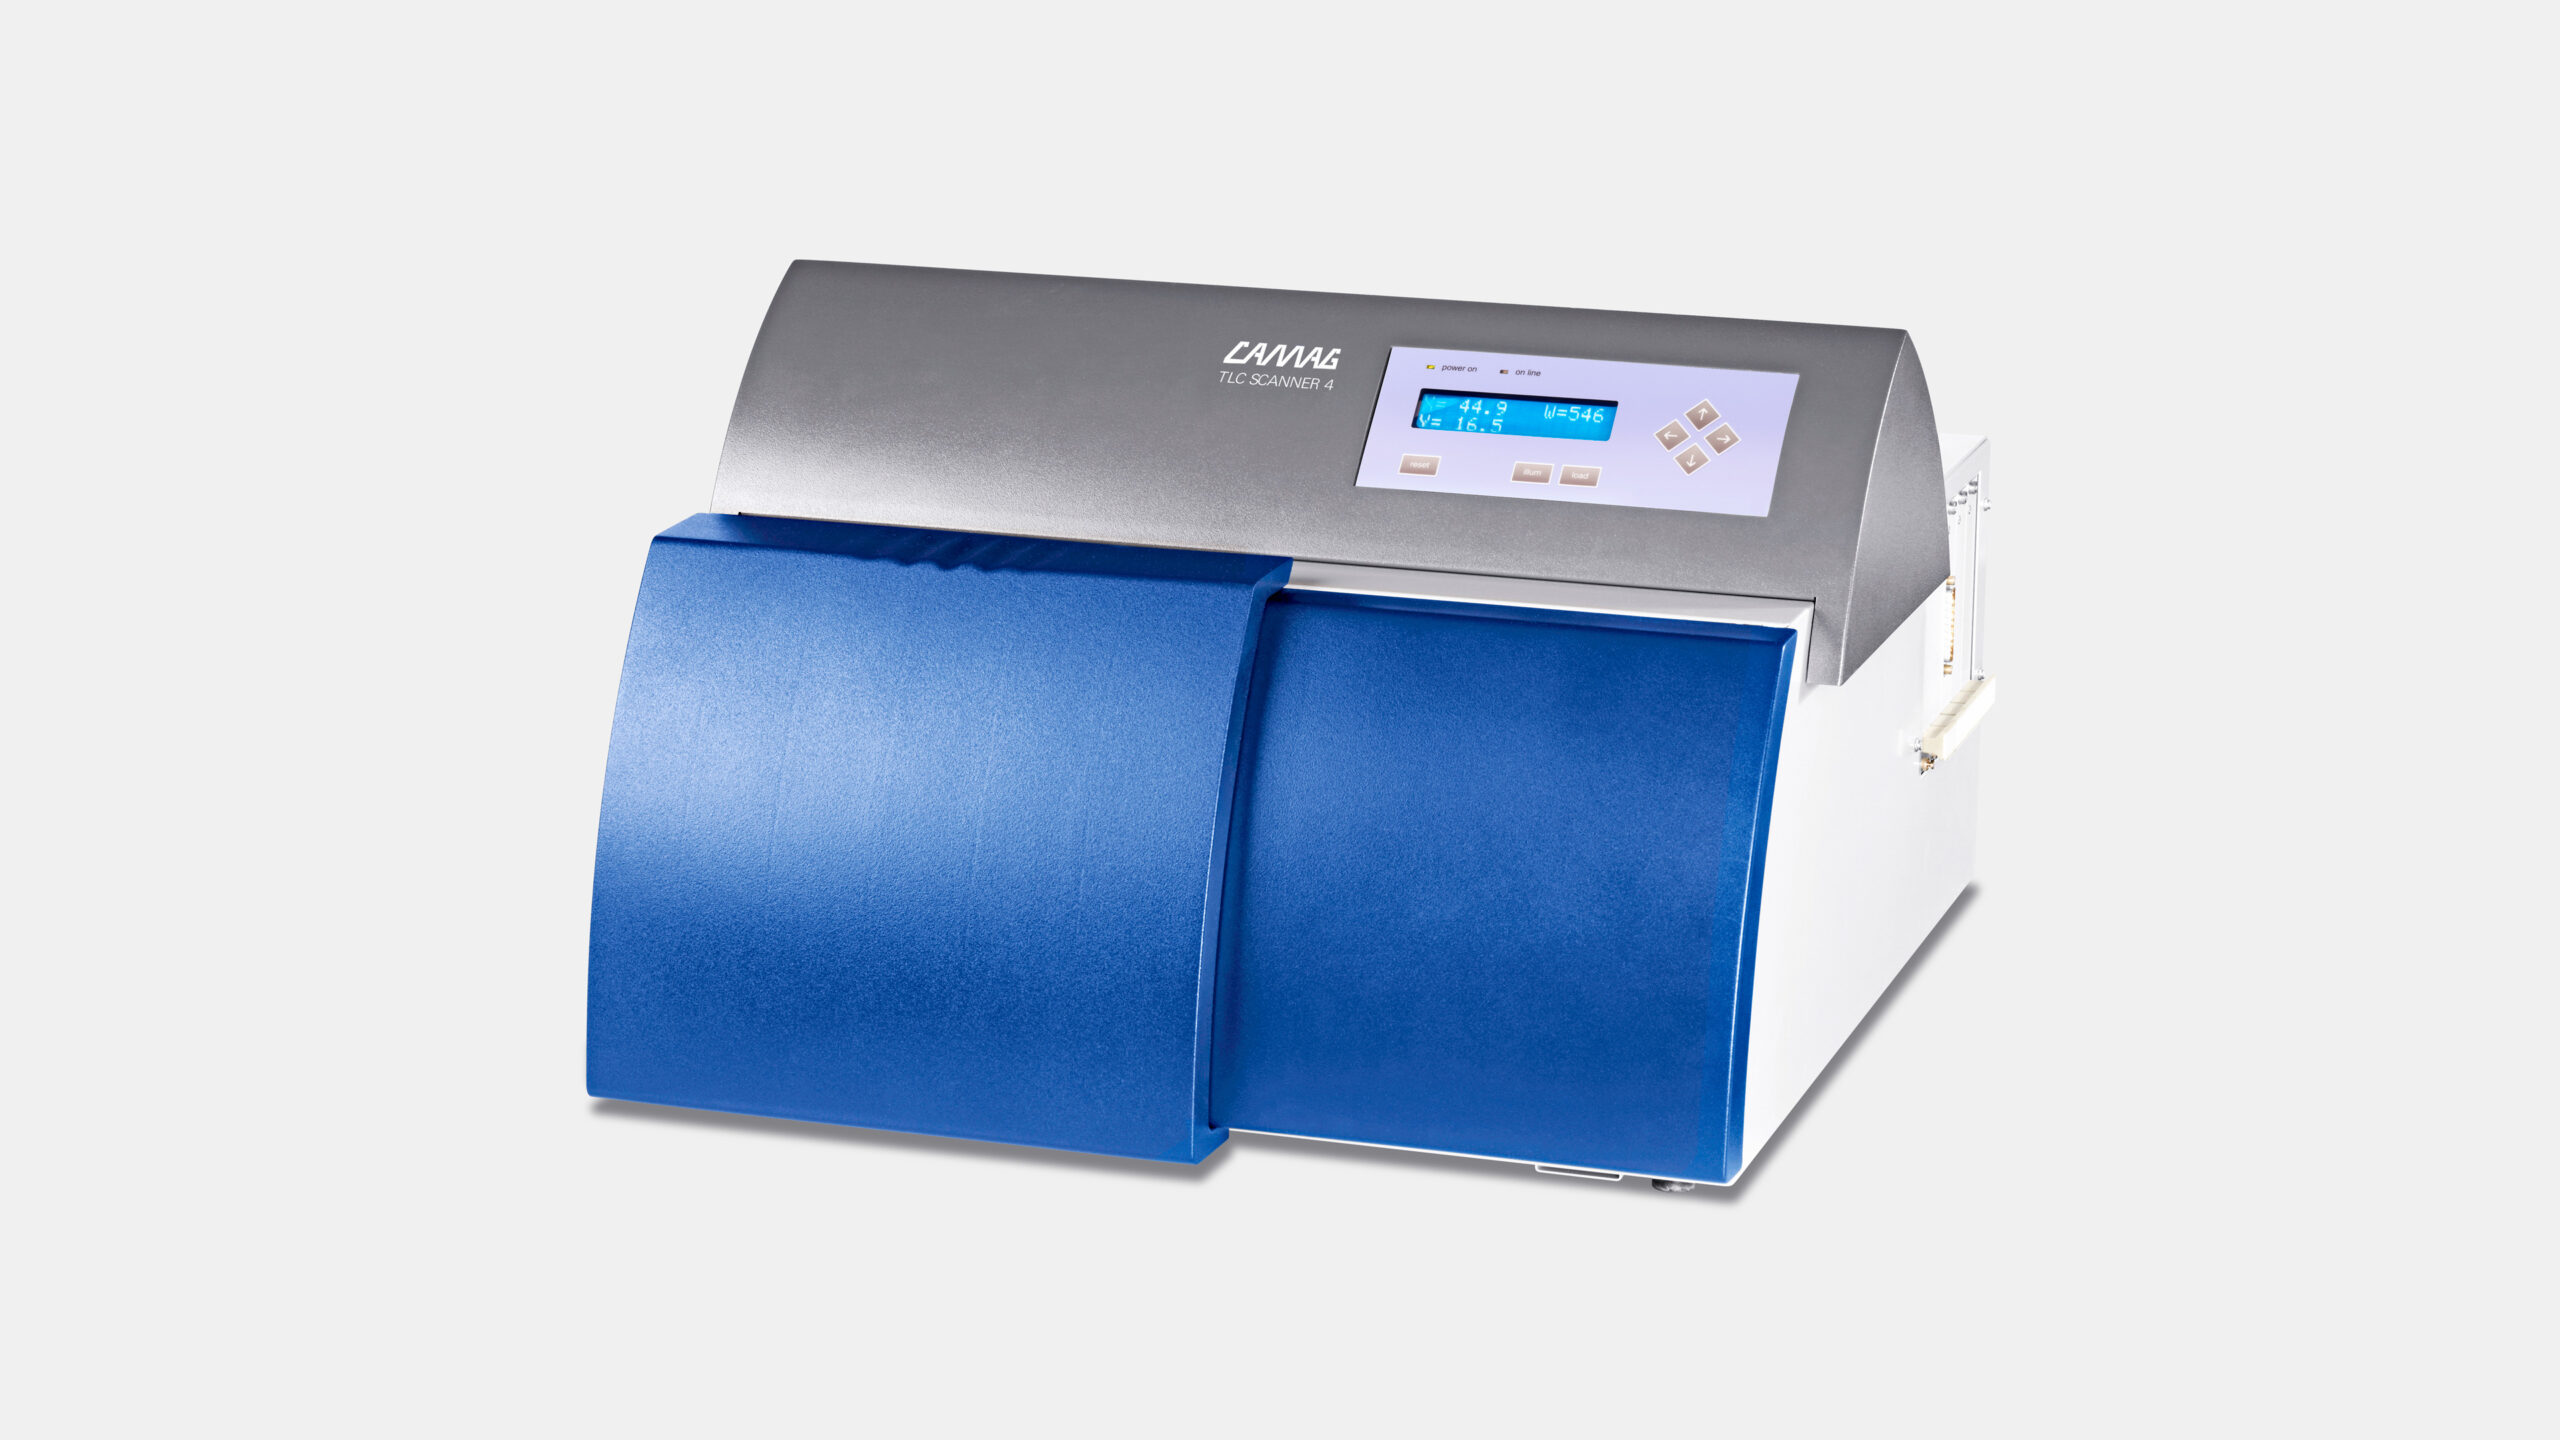
Figure 13: CAMAG® TLC Scanner 4
Literature
[1] Thin-Layer Chromatography: Reagents and Detection Methods, Physical and Chemical Detection Methods: Fundamentals, Reagents I; Vol. 1a, H. Jork et al., VCH, 1990
[2] Thin-Layer Chromatography: Reagents and Detection Methods. Physical and Chemical Detection Methods: Activation Reactions, Reagent sequences, Reagents II. Vol. 1b; H. Jork et al., VCH, 1994

![HPTLC-MS full scan mass spectrum of Rebaudioside A zone showing most pronounced signals at m/z 989.6 [M+Na]+](/wp-content/uploads/2024/08/cs_stevia_img_2_1.png)


![Graphical abstract from [1]](/wp-content/uploads/2024/08/CBS128_Identification-and-quantification-of-glucose-degradation-products_img1.png)


![Mean recoveries of CP from vegetable oils in % ± standard deviation (n = 4) at spiking levels of 5, 10, and 30 mg reference CP/kg of oil. Modified from [1].](/wp-content/uploads/2024/08/CBS-128_Screening-for-chlorinated-paraffins_tbl1.png)
![Total CP amounts in six dietary supplement samples from the European market by pSPE–VIS and GC/ECNI–HRMS in mg reference CP/kg of sample ± standard deviation (n = 4). Modified from [1].](/wp-content/uploads/2024/08/CBS-128_Screening-for-chlorinated-paraffins_tbl2.png)