Extended and Fully Automated Newborn Screening Method for MS Detection
Abstract
To read the complete publication, click here.
To read the complete publication, click here.
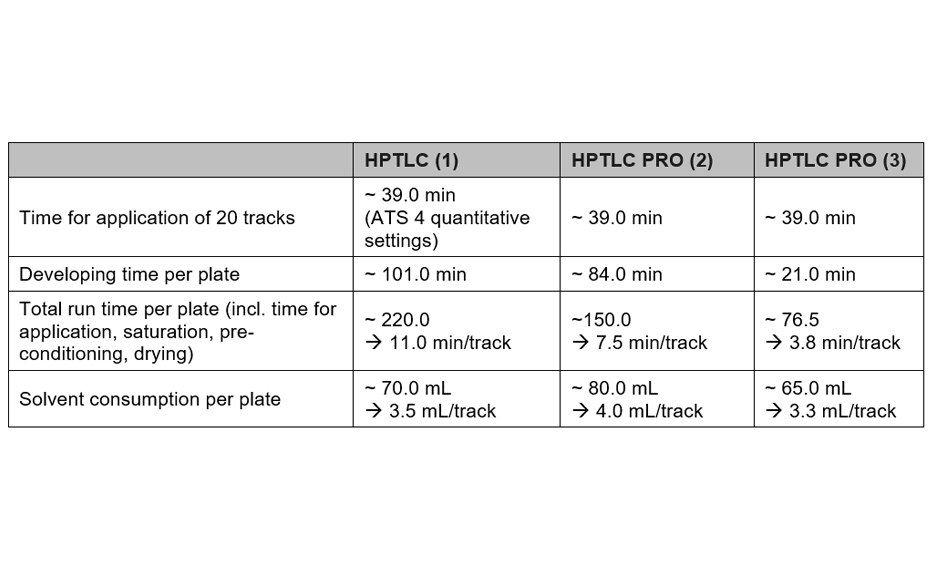
The quantification of simple sugars can be challenging due to their high polarity, low volatility, their lack of a chromophore and their common occurrence in complex matrices [1–3]. HPTLC can separate mono- and oligosaccharides after minimal sample preparation and can sensitively detect these compounds after post-chromatographic derivatization. The published method for quantification of sugars in honey [2] allows analyzing multiple samples on a single plate within approximately 3.7 hours. With the method transferred to the new HPTLC PRO System, this test can be accomplished in about 2.5 hours. An alternative method developed for HPTLC PRO requires just 1.3 hours per plate.
HPTLC allows quantification of sugars in honey and other complex matrices at low running costs. Depending on the level of equipment used, the speed, automation and reliability of the obtained quantitative results can be increased. With the new method developed for the HPTLC PRO System, the main sugars in honey can be investigated in short time and other sugars, such as oligomers present in fermentation processes, can be analyzed at the same time.
Standard solutions
Individual sugars are dissolved in 50% aqueous acetonitrile with sonication to obtain a final concentration of 1.0 mg/mL for qualitative tests, method transfer and method development. For quantification and during determination of the working range, a mixture of fructose, maltose, sucrose, and glucose at concentration levels between 12.5 μg/mL–1000.0 μg/mL is used in 50% aqueous acetonitrile.
Sample preparation
The samples are dissolved in 50% aqueous acetonitrile with sonication to obtain a final concentration of 1.0mg/mL for qualitative tests and are applied in 20-fold dilution for quantification of the two main sugars in honey (fructose, glucose).
HPTLC plates silica gel 60 F254 (Merck), 20 x10 cm are used.
Samples and standard solutions are applied as bands with the Automatic TLC Sampler (ATS 4, quantitative settings, 10 μL syringe) or the HPTLC PRO Module APPLICATION using the default settings (two rinsing solutions), 20 tracks, band length 6.0 mm, distance from left edge 18.0 mm, track distance 8.5 mm, distance from lower edge 8.0 mm. 1.0–3.0 μL for sample solutions and 1.0 μL for standard solutions are applied.
(1) Plates are developed in the ADC 2 with chamber saturation (with filter paper, 60 min), after activation at 33% relative humidity (*) for 10 min using a saturated solution of magnesium chloride, followed by 5 min pre-conditioning, development with n-butanol – isopropanol – aqueous boric acid (5 mg/mL) 3:5:1 (V/V) to the developing distance of 85 mm (from the lower edge), followed by drying for 15 min** [2]. (2) Plates are developed in the HPTLC PRO Module DEVELOPMENT after activation at 0% relative humidity (*molecular sieve) for 10 min, followed by 90 s pre-conditioning at 30% pump power, development with n-butanol – isopropanol – aqueous boric acid (5 mg/mL) 3:5:1 (V/V) to the developing distance of 70 mm (from the lower edge), followed by drying for 15 min. (3) Plates are developed in the HPTLC PRO Module DEVELOPMENT after activation at 0% relative humidity (molecular sieve) for 10 min, development with ethyl acetate – methanol – boric acid (5 mg/mL) – acetic acid 50:40:10:2 (V/V) to the developing distance of 70 mm (from the lower edge), followed by drying for 5 min.
Note: *methods (1) and (2) are very robust and no significant differences for the RFvalues were obtained between 0 and 33% relative humidity; **deviation from [2]
Post-chromatographic derivatization
Aniline-diphenylamine-phosphoric acid reagent (ADPA reagent): 2.0 g of diphenylamine and 2.0 mL of aniline are dissolved in 80.0 mL of methanol, 10.0 mL of o-phosphoric acid (85%) are added and the mixture is shaked until any precipitate is dissolved, then again 10.0 mL of methanol are added. The plate is sprayed with the Derivatizer (yellow nozzle, spraying level 6), heated at 110°C for 10 min on the TLC Plate Heater.
Images of the plate are captured with the TLC Visualizer 2 at UV 366 nm and white light after derivatization.
Densitometry
Absorbance measurement at 370 nm [3] is performed with TLC Scanner 4 and visionCATS 3.0 (slit dimension 5.00 mm x 0.30 mm, scanning speed 50 mm/s, data resolution 25 μm/step for single-wavelength scan, spectra recording from 350–800 nm).
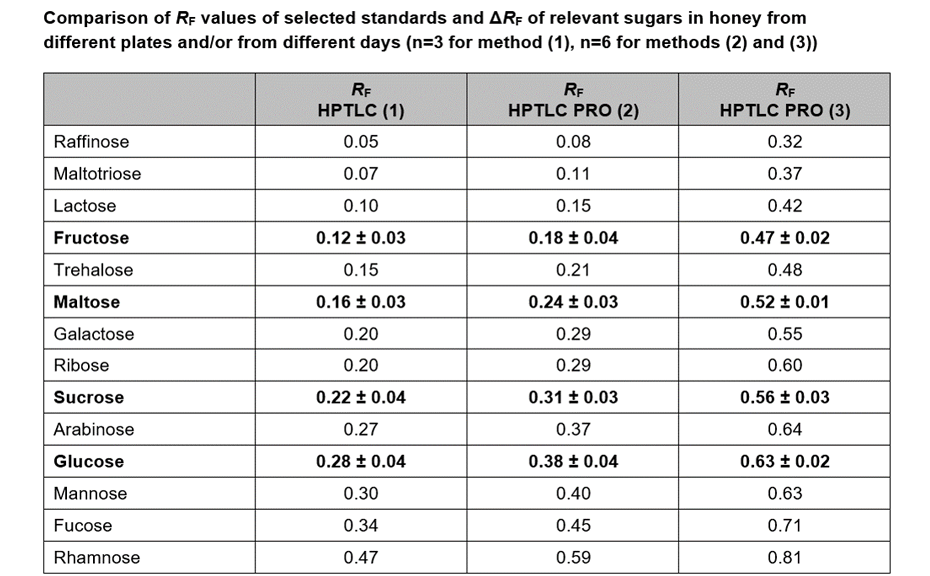
The methods have been compared for their consumption of time and consumables, and their repeatability: method (1) with the conditions from [2] by using the ATS 4 and ADC 2, method (2) with the developing solvent from [2] by using the HPTLC PRO Modules APPLICATION and DEVELOPMENT, and method (3) with an alternative developing solvent by using the HPTLC PRO Modules APPLICATION and DEVELOPMENT. All three methods are well suited for quality control of honeys.
The UV/VIS spectra recorded after derivatization show a high signal response for all analytes at 370 nm. Therefore, LODs/LOQs have been determined for the four relevant sugars in honey at this wavelength to facilitate evaluation in routine quality control by using scanning densitometry at a single wavelength (LOD370 nm/LOQ370 nm for fructose and sucrose: 6.0/18.0 ng/zone, for maltose and glucose: 12.0/48.0 ng/zone). The linear working range extends from LOQ370 nm to 125.0 ng/zone.
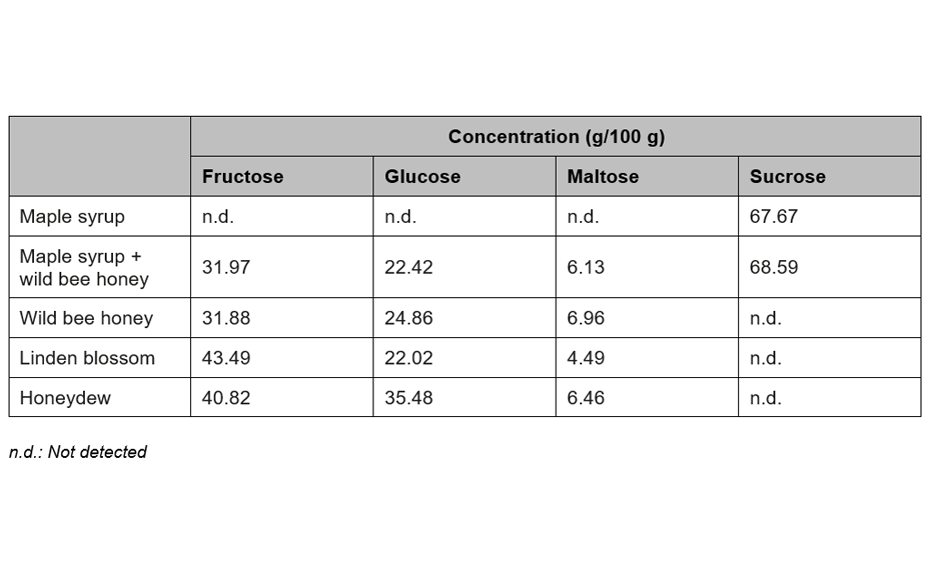
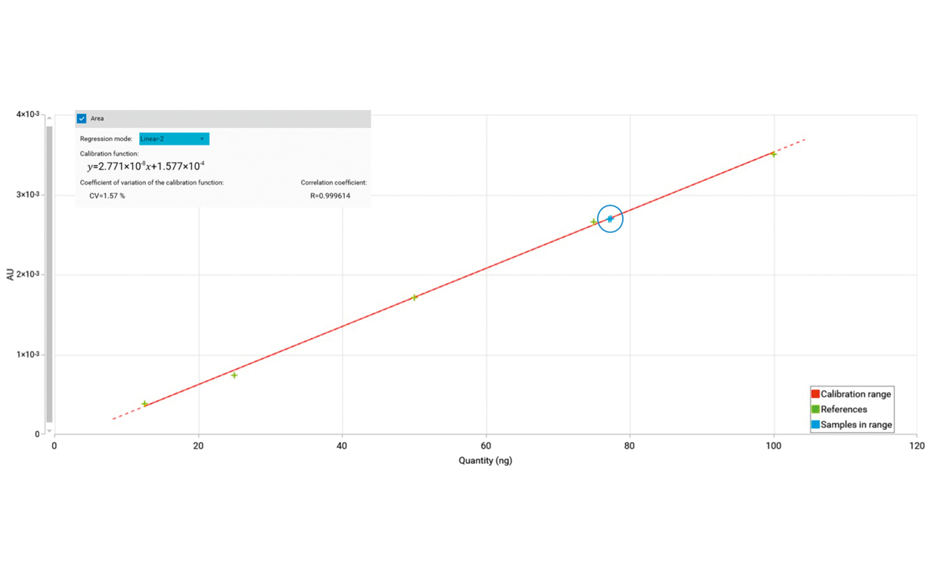
For the quantification of fructose, maltose, sucrose, and glucose, method (2) is recommended. In this case, the best separation of the four analytes in an optimum RF range is achieved in significantly less run time compared to method (1). To proof the suitability of the method (2) for quantification, four samples of honey have been selected of which one was mixed with maple syrup 1:1 to determine the recovery. The results are listed in Table 2.
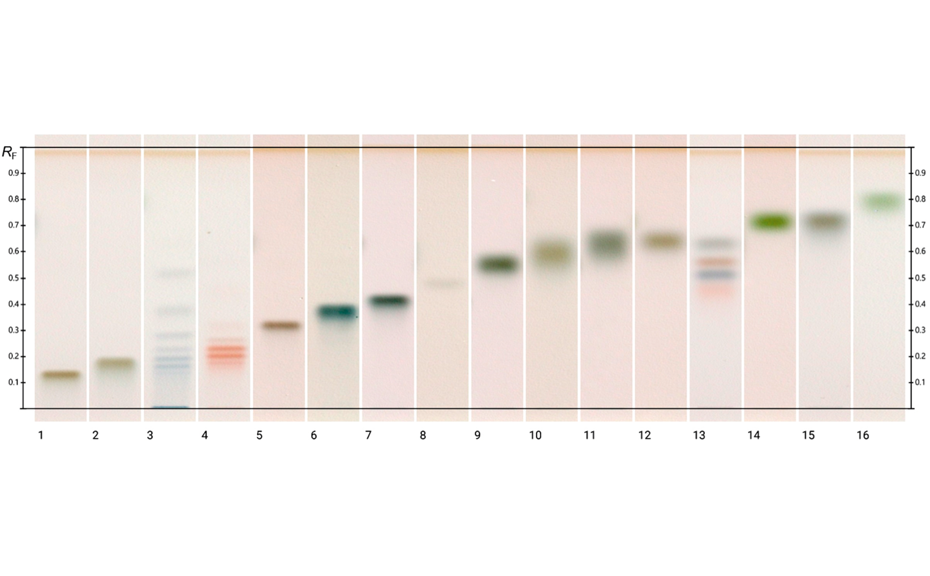
Method (3) is best suited for the analysis of sugars of different sizes (mono- and oligomers) and sugar acids of high polarity (e.g. glucuronic acid). The entire migration distance is used for separation whereas methods (1) and (2) are optimized for the separation and quantification of mono- and dimers.
SMOOTH & PRECISE OPERATION
01
Table 1
02
Table 2
03
Table 3
Conclusion
With the three methods described herein, the principal sugars of honey can be analyzed at low running costs. The instrument investment costs for method (1) are lower, but more time and manual intervention is required for each analysis. Methods (2) and (3) have been developed for routine quality control and a high sample throughput. In this case, the level of automation and reduced time per sample are of greater importance, making the HPTLC PRO System the better choice. Method (3) can be used for sugar analysis in general, e.g. for optimization and monitoring of fermentation processes and for analysis of sugar containing products in divers matrices.
SMOOTH & PRECISE OPERATION
01
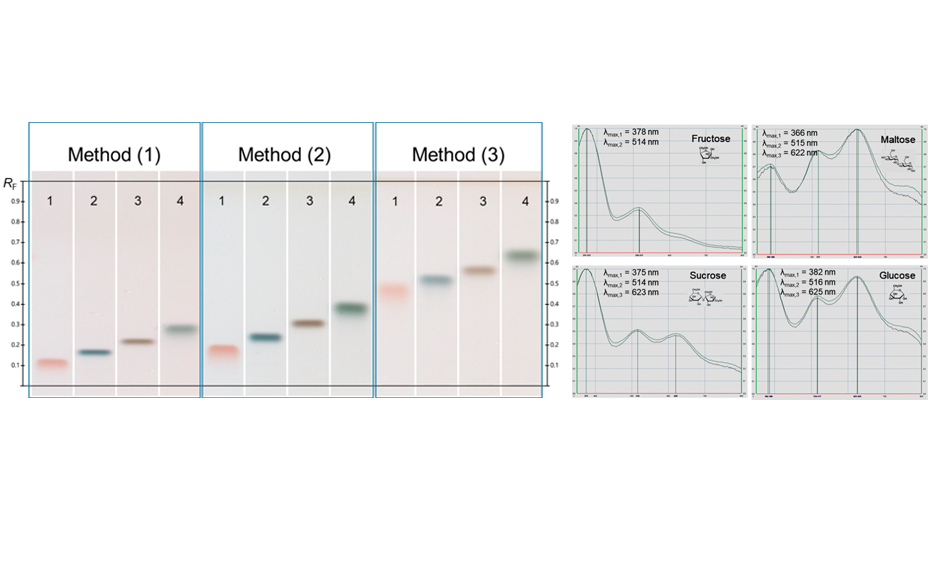
HPTLC chromatograms at white light after derivatization with ADPA reagent: tracks 1–4 standards fructose, maltose, sucrose, and glucose with increasing RF; UV/Vis spectra from 350–800 nm (recorded on the plate obtained with method (3))
02
Calibration curve of sucrose (method 2); blue circle shows the amount detected in the samples maple syrup and wild bee honey mixed with maple syrup.
03
HPTLC chromatograms of different standards (method 3) at white light after derivatization; track 1: galacturonic acid, 2: glucuronic acid, 3: maltodextrin, 4: fructo-oligosaccharides, 5: raffinose, track 6: maltotriose, 7: lactose, 8: trehalose, 9: galactose, 10: ribose, 11: mannose, 12: arabinose, 13: mixture of fructose, maltose, sucrose, and glucose (250 ng each), 14: fucose, 15: xylose, 16: rhamnose (1 μg each, except for the mixture on track 13)
Literature
[1] M. K. Islam et al. J Planar Chromatogr (2020) 33(5):489–499
[2] M. K. Islam et al. Molecules (2020) 25(22)
[3] G.E. Morlock, G. Sabir, J Liquid Chromatogr (2011) 34:902–919
Contact: Dr. Melanie Broszat, CAMAG, Sonnenmattstrasse 11, 4132 Muttenz, Switzerland, melanie.broszat[at]camag.com
The research team at the University of Western Australia (UWA), Division of Pharmacy, in collaboration with the Cooperative Research Centre for Honey Bee Products Limited (CRC-HBP) develops a HPTLC based real-time honey assessment tool for beekeepers and packers to determine a honey’s floral source alongside the collation of key phytochemical parameters and bioactivity data for a wide range of Australian honeys. The team currently also investigates potential correlations between phytochemical characteristics of honeys and their bioactivity. Using HPTLC as a qualitative and quantitative honey analysis tool, they monitor changes over time, and caused by storage and handling conditions. Moreover, a HPTLC based method for the detection of sugar syrup adulterants in honey has also recently been developed.
Honey is derived from nectar collected by honey bees from a range of floral sources. After collection, numerous processes take place outside and also within the hive, such as exposure to bee related enzymes and removal of moisture, which ultimately convert the nectar into honey. Honey can be considered a complex natural product, consisting of a high amount of sugars (>70%), residual moisture (typically 17–20%) and a small portion (approx. 3%) of non-sugar constituents, including minerals, vitamins, protein, phenolics and flavonoids. These minor constituents are directly related to the honey’s nectar source and thus play a critical role in the authentication of honeys. They also influence the honey’s organoleptic and physicochemical characteristics as well as its level of bioactivity. Antioxidant activity is linked to high concentrations of phenolics, phenolic acids, anthocyanins, hydroxycinnamic acid derivatives and flavonoids. DPPH* (2,2-diphenyl-1- picrylhydrazyl, C18H12N5O6) is a powerful radical used for the antioxidant screening of compounds, mixtures of constituents, extracts and biological matrices, such as wine, fruit juices, salivary secretions and plant extracts, and also, as demonstrated in this study, honey.
The phytochemical composition of honeys depends on the floral nectar source and thus on the geographic origin and time of harvesting. It might also be influenced by processing and storage conditions, by the bee species collecting the nectar and the bee enzymes the nectar and honey come in contact with. Despite this complexity, honeys from the same floral species present characteristic constituent patterns, which can be used in the authentication of their floral source. These patterns can be effectively captured by HPTLC analysis of honeys’ organic extracts and can thus assist in the authentication of their floral origins.
As a major source of energy, carbohydrates, including simple sugars such as glucose, fructose, sucrose, maltose or galactose, play an important role in human nutrition. The determination of their content in various botanical products and food items is therefore of interest. However, the quantification of simple sugars is not without challenges due to their high polarity, low volatility and lack of a sizeable chromophore. Furthermore, these sugars are often found in complex matrices, which require their separation from proteins, fats, and / or minerals as well as other matrix constituents prior to analysis.
Herein, three different methods for the analysis of honey samples are presented. Method A is suited for the honey floral source identification by HPTLC fingerprinting, method B enables a fast assessment of antioxidant zone activity, and method C allows to quantify sugars and to detect sugar adulterants in honey.
The developed authentication method (A) is rapid, reliable, and repeatable and can therefore be used as a convenient analytical tool in routine honey quality control. The method involves a simple solvent extraction step followed by a short chromatographic development time (9 –10 min). It requires minimal solvent and reagent input while allowing the simultaneous analysis of up to 14 samples on a single plate. HPTLC-DPPH analysis (B) is advantageous over traditional assays which measure the total antioxidant activity, as it can detect individual active compounds and quantify their respective contribution to the overall antioxidant effect. The analytical approach is easy and fast to perform and powerful in visualizing antioxidant compounds. Further, their respective< activity can be quantified as gallic acid equivalents, even if their chemical identity is unknown. The developed method for sugar analysis (C) is convenient and easy to perform in a single development step with minimal sample pre-treatment. Moreover, only small sample quantities (approx. 100 mg) and small volumes of development solvent (approx. 35 mL) are needed for the analysis of multiple samples in a single run, which makes the method also a very cost effective approach to easily detect and quantify major sugars in honey.
Standard solutions
(A) Reference solution of 4,5,7-trihydroxy-flavanone (0.5 mg/mL) is prepared in methanol. (B) Standard stock solution of gallic acid (20 μg/mL) is prepared in methanol. (C) Standard glucose, fructose, sucrose and maltose solutions (250 μg/mL) are prepared in 50% aqueous methanol with sonication.
Sample preparation
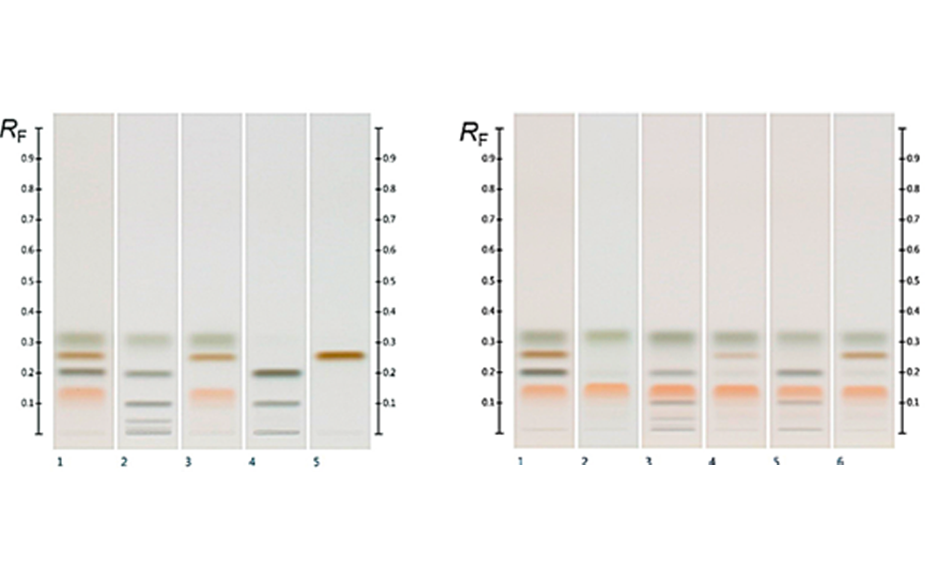
(A and B) Manuka, Jarrah, Banksia and Marri honeys, and a honey of an unidentified floral source referred here as UNF (Supermarket honey; unidentified floral origin); 1 g of each honey is mixed with 2 mL of deionized water, then extracted three times with 5 mL of dichloromethane. The combined organic extracts are dried at ambient temperature and reconstituted in 100 μL of dichloromethane prior to analysis. (C) Two honeys (Manuka and Jarrah); four different sugar syrups (Maple, Corn, Golden, and Glucose); and artificially adulterated Manuka and Jarrah honey with four different sugar syrups at 30% concentration. The sample solutions (1 mg/mL) are prepared using 50% aqueous methanol.
Chromatogram layer
HPTLC glass plates silica gel 60 F254 (Merck) 20 x10 cm are used.
Sample application
With the Linomat 5 between 1.0 –7.0 μL of the standard and 3.0 –5.0 μL of each sample solution are applied as 8 mm bands at 8 mm from the lower and 20 mm from the left edge of the HPTLC plate (dosage speed 150 nL/s for A and B and 50 nL/s for C).
Chromatography
(A and B) With the Automatic Development Chamber (ADC 2) the plates are conditioned to 33% relative humidity, pre-conditioned for 5 min, and developed to a distance of 70 mm in a saturated chamber (20 min for saturation). The developing solvent is toluene – ethyl acetate – formic acid 6:5:1 (v/v) [1, 2, 3]. Plates are dried for 5 min in the ADC 2. (C) With the Automatic Development Chamber (ADC 2) the plates are conditioned to 33% relative humidity, pre-conditioned for 5 min, and developed to a distance of 85 mm in a saturated chamber (60 min for saturation). The developing solvent is 1-butanol – 2-propanol – aqueous boric acid (5 mg/mL) 30:50:10 (v/v/v) [5]. Plates are dried for 5 min in the ADC 2.
Post-chromatographic derivatization
(A) The plates are derivatized with 3.0 mL of vanillin reagent using the Derivatizer (yellow nozzle, level 3) and heated for 3 min at 115 °C using the TLC Plate Heater. (B) The plates are derivatized with 2.0 mL of 0.4% DPPH reagent using the Derivatizer (yellow nozzle, level 1). (C) The plates are derivatized with 2.0 mL of aniline – diphenylamine – phosphoric acid reagent using the Derivatizer (yellow nozzle, level 5). The derivatized plates are heated for 10 min at 115°C using the TLC Plate Heater.
Documentation
With the TLC Visualizer 2 at UV 254 nm and UV 366 nm after development (A) and in white light (A, B*, C) and UV 366 nm (A) after derivatization (for B 60 min after reagent transfer).
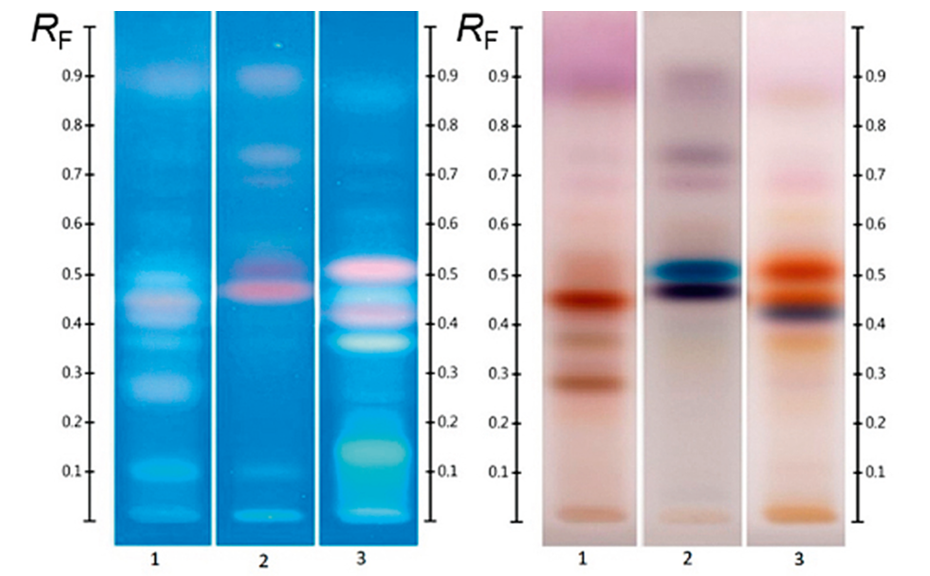
(A) Figure 1 shows the HPTLC fingerprints of three different honeys, labelled as Jarrah, Banksia and Marri, obtained at UV 366 nm and white light after derivatization. The two sets of images show a unique pattern for each honey within a RF range of 0.05 to 0.60, representative of each honey’s specific fingerprint.
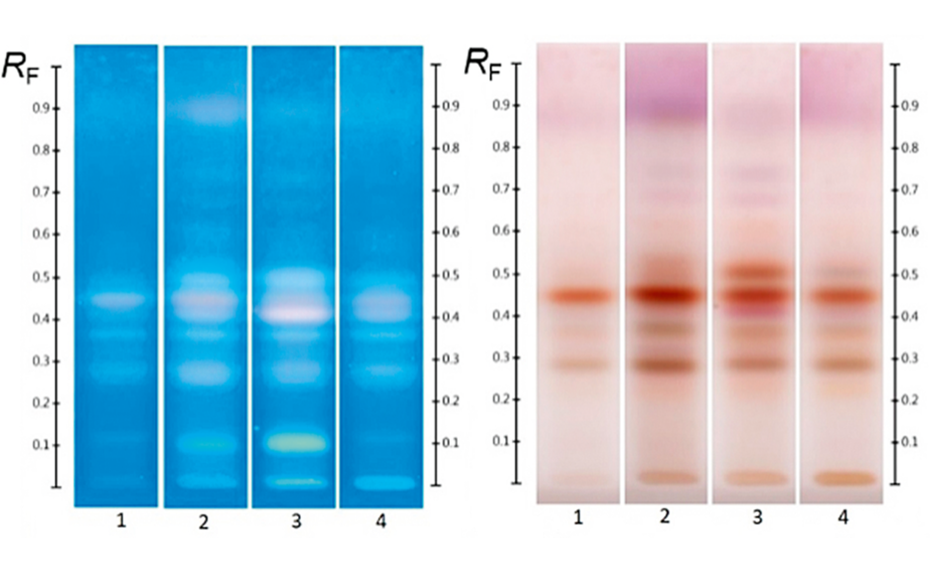
Four different honeys, all purchased labelled as Jarrah honeys, were analyzed at UV 366 nm and at white light after derivatization (Figure 2). Though obtained from different suppliers, all honeys share common zones between RF 0.05 to 0.60 in their fingerprint, which can serve as a convenient authentication tool.
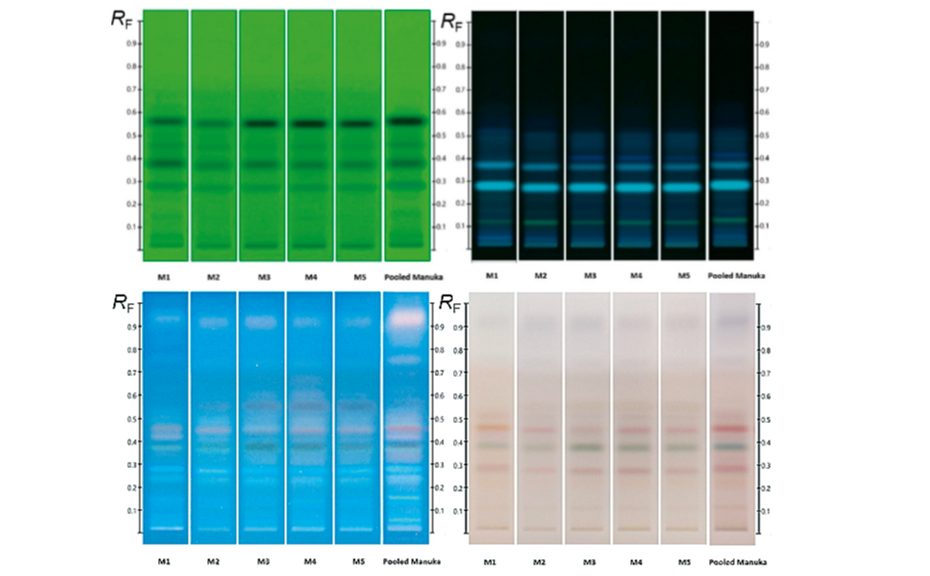
As a natural product, the composition of honey, even when derived from the same floral nectar, can be expected to exhibit some natural variation between samples. In order to obtain a representative fingerprint and to limit the impact of natural variation on the effectiveness of the method as an authentication tool, individual samples were pooled to produce an ‘average’ fingerprint, in which major deviations from the norm were ‘diluted out’ and key compounds, representative of the floral source across all samples, were amplified.
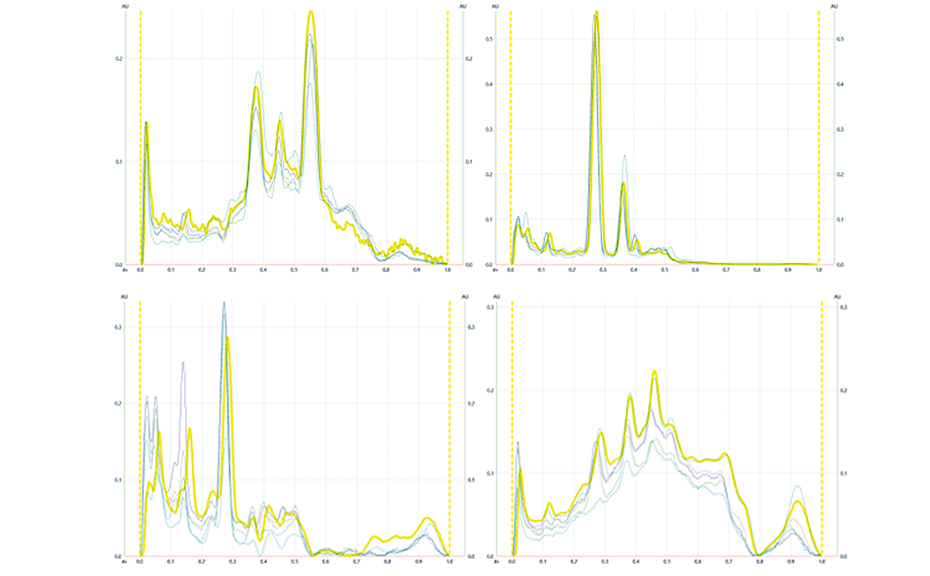
The effectiveness of this approach is demonstrated in Figure 3 where a pooled HPTLC fingerprint captures the key features of five individual samples, all labelled as Manuka honey. Slight variations present in the Manuka samples (e.g. zones at RF 0.41 at UV 366 nm after development and at RF 0.55 and RF 0.38 at UV 366 nm after derivatization, as well as individual zone intensities, which correspond to compound concentrations) are no longer evident in the pooled fingerprint.
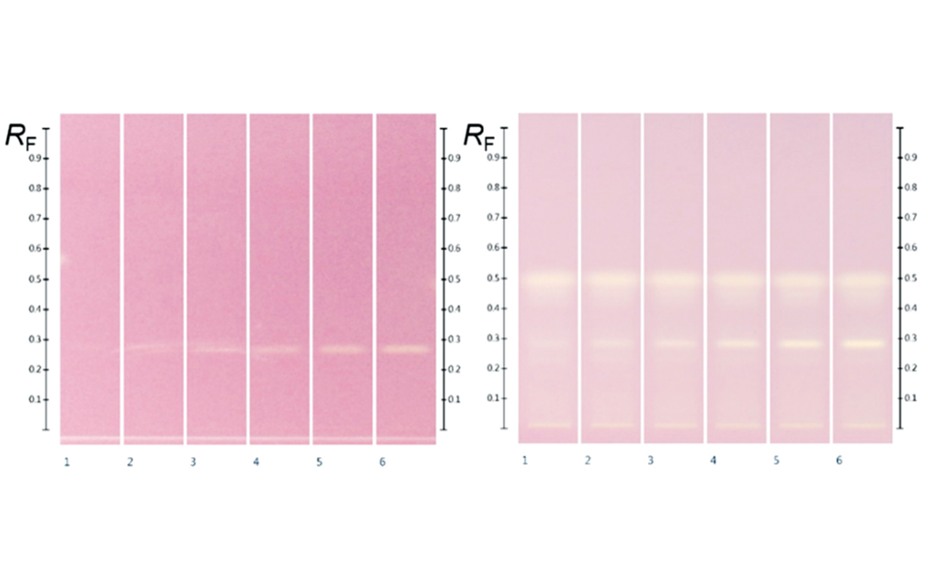
(B) After derivatization, the plate background appeared dark pink, reflecting the color of DPPH* in its reduced state. Where constituents with antioxidant activity reacted with DPPH*, the intensity of the background color was diminished, visualizing compounds with antioxidant zone activity. The stronger the antioxidant activity, the brighter white the active zone appeared against the pink background. Gallic acid was detected on the plate at RF 0.29 after derivatization.
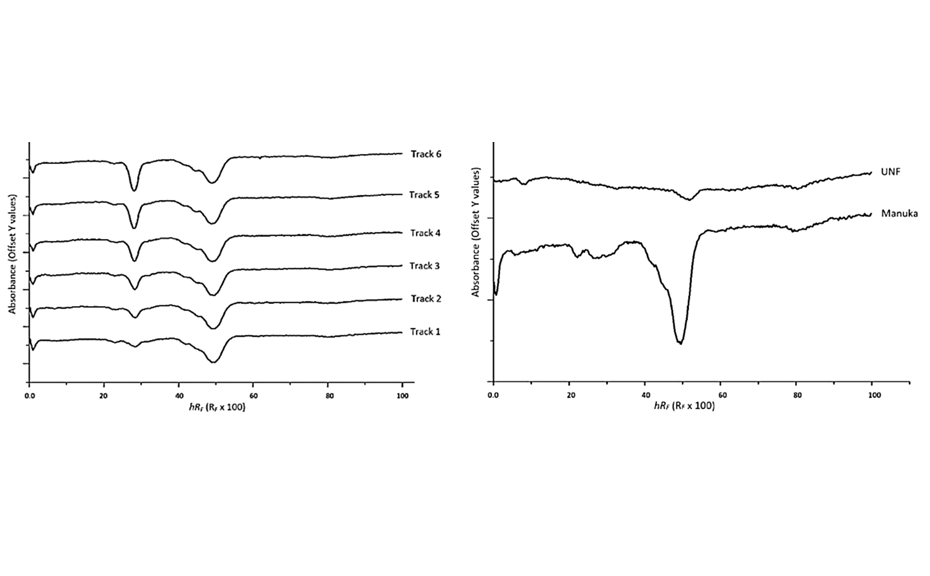
For the quantitative analysis of antioxidant zone activity of honey as gallic acid equivalents, the obtained images were converted into peak profiles (PPI), which were used to derive calibration curves of absorbance vs concentration. Using the trend line equations from the calibration curves, the LOD and LOQ were found to be 16.5 ng and 50.0 ng for gallic acid in honey and 14.3 ng and 43.3 ng for pure gallic acid in methanol [3]. As there were no noticeable differences between the LOD and LOQ of gallic acid in methanol and in the honey matrix, it could be concluded that the honey matrix did not have an interfering effect.
The accuracy of the method (expressed as mean recovery) was within 99.9 to 101.5%. Precision (intra-day and inter-day) and repeatability expressed as standard deviation (SD) and %RSD were between 0.69 and 2.29 (SD) and between 1.01 and 3.07% (%RSD). Repeatability was found to fall within a range of 0.49 – 1.83 (SD) and 0.60 – 2.25% (%RSD). The above parameters were all within the International Conference on Harmonization (ICH) guidelines and, thus, confirmed the validity of the method.
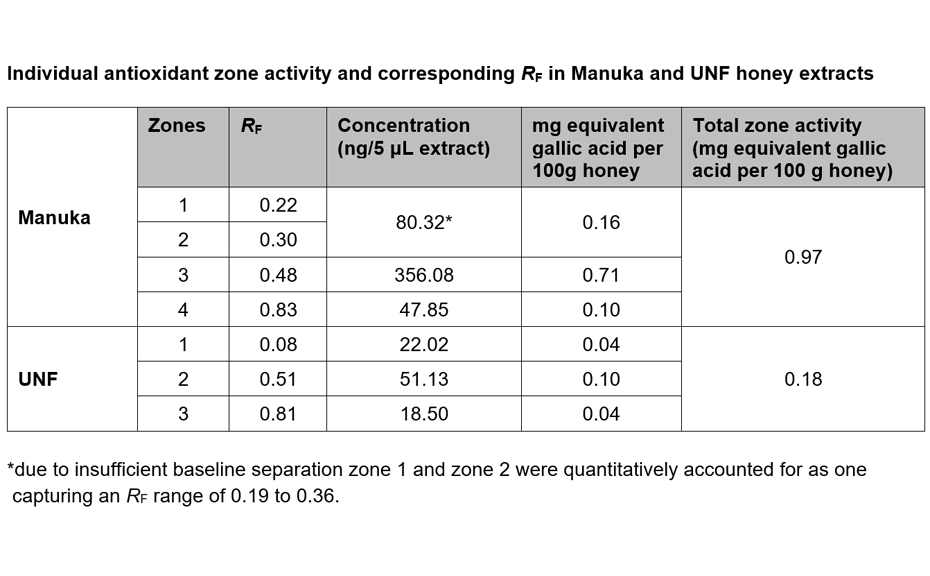
The validated HPTLC-DPPH analysis was used to visualize and quantify as gallic acid equivalents the antioxidant activity of individual zones found in Manuka and UNF honey extracts. Four antioxidant zones were detected in Manuka and three active zones in UNF honey extracts.
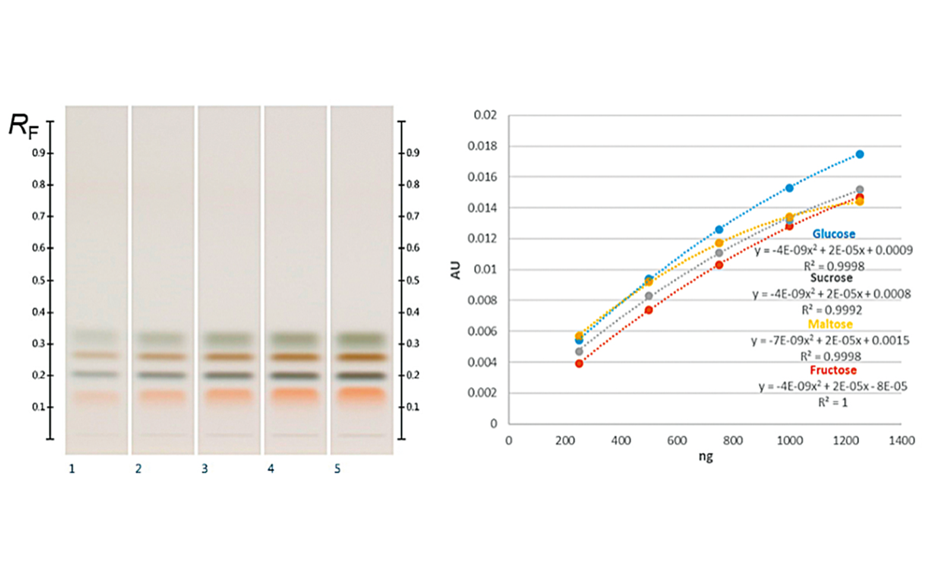
(C) At white light individual sugars presented distinct, bright colors: glucose was dark ash, fructose orange, sucrose dark brown and maltose dark green colored. Their corresponding RF values were for fructose RF 0.14, maltose RF 0.20, sucrose RF 0.27 and glucose RF 0.32 [5].
All the major sugars in honeys were clearly separated from the matrix and the sugars themselves were clearly separated from each other, forming distinct individual zones. The working range of the evaluated method was determined within the range of 250‒1250 ng/zone. The sensitivity of the method (LOD/LOQ) was calculated; LOD/LOQ for glucose: 33.0/100.0 ng; fructose: 22.0 ng/66.6 ng; sucrose: 21.2 ng/64.2 ng; maltose: 63.5 ng/192.5 ng, respectively. The accuracy, precision (intra-day and inter-day), repeatability and robustness of the developed method were also assessed and were within the acceptable ranges outlined in the International Conference on Harmonization (ICH) guidelines.
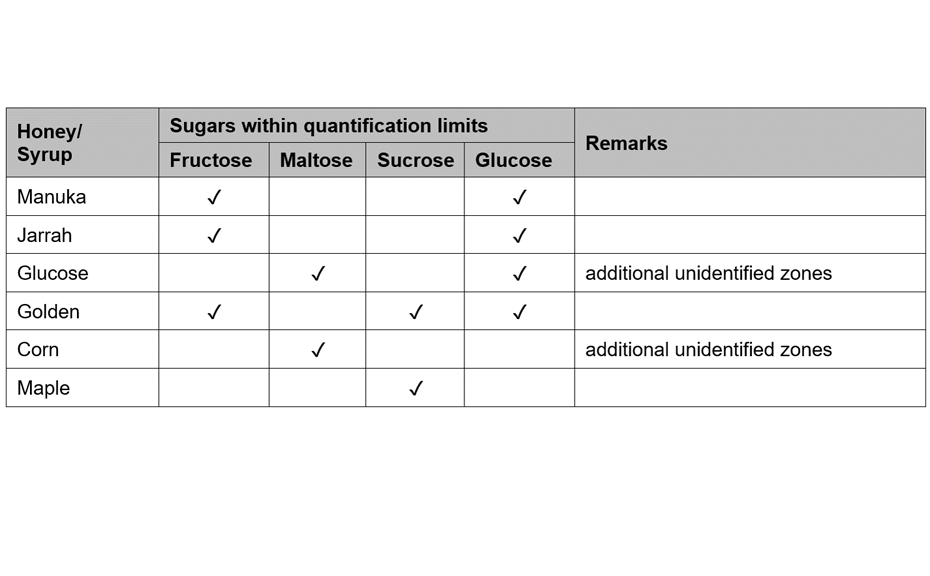
Fructose and glucose contents were readily quantifiable in all honey samples, but maltose and sucrose, if present, were below the LODs in the volumes (3.0 μL) applied (though they can be detected at higher application volumes). In all purposefully adulterated honeys, next to fructose and glucose other sugars like maltose and sucrose were easily quantifiable as they were within the working range.
Thus, mixing honey with sugar syrups leads to significant changes in the amount of sugars such as maltose and sucrose that normally are only present in minor quantities. These changes are easily detected by HPTLC analysis, as described here, and the method can, therefore, be used not only to quantify major sugars in honey but also as quality control tool to detect sugar syrup adulterations in honey.
01
Table 1
02
Table 2
Conclusion
(A) HPTLC fingerprint profiling of honey extracts is a quick visual screening method that can also be used for quality control to authenticate a honey’s floral origin. The predominant nectar source can be confirmed, additionally unknown or non-specific zones can be investigated for potential additional floral and non-floral compounds, which might assist in detecting adulteration cases. The method is convenient and cost-effective due to the ability to run multiple samples (up to 14) on a single plate.
(B) The study herein used honey as a model matrix to demonstrate the ability of HPTLC-DPPH analysis to visualize and quantify the antioxidant activity of individual constituents in a complex matrix even if their respective chemical identity is not (yet) known. It is anticipated that the approach can also be adopted for the analysis of other matrices with antioxidant activity like plant extracts. The method established here, provides guidance on how to examine other complex systems for potential matrix effects and to capture antioxidant activities of individual constituents.
(C) The HPTLC method for the detection and quantification of simple sugars in honey is easy to perform and offers a convenient approach to not only quantify the major sugars found in honey but also to identify potential adulteration with sugar syrups. The absence of any pre-treatment steps prior to analysis is a major advantage, which might make the method also an interesting analysis approach for the determination of simple sugars in other botanicals and foods.
01
Different honeys labelled as “Jarrah” (track 1), “Banksia” (track 2) and “Marri” (track 3); image at UV 366 nm (left) and white light (right) after derivatization with vanillin reagent
02
Different honeys labelled as “Jarrah”; image at UV 366 nm and white light after derivatization with vanillin reagent
03
HPTLC fingerprints of several Manuka samples along with pooled sample; (from left to right) images at UV 254 nm, UV 366 nm after development and UV 366 nm and white light after derivatization
04
HPTLC peak profiles fromimages (PPI) ofManuka samples along with pooled sample highlighted in yellow at UV 254nm (1) and UV 366 nm(2) after development as well as at UV 366 nm(3) and white light (4) after derivatization with vanillin reagent
05
HPTLC chromatograms at white light after DPPH; (left) gallic acid (RF 0.29) 2.0, 3.0, 4.0, 5.0, 6.0, and 7.0 μL of the standard solution in methanol; (right) Manuka extracts (5 μL) overspotted with gallic acid 2.0, 3.0, 4.0, 5.0, 6.0, and 7.0 μL respectively
06
(left) PPI of a Manuka extract (5.0 μL) over-spotted with 2.0–7.0 μL of gallic acid (RF = 0.29 ≙ hRF = 29); (right) PPI of Manuka extract (5.0 μL) and UNF (10.0 μL)
07
Fructose (RF 0.14), maltose (RF 0.20), sucrose (RF 0.27) and glucose (RF 0.32) zones, and their corresponding calibration curves
08
(left) HPTLC chromatograms of standards (track 1) and different syrups (from track 2–5: glucose, golden, corn, and maple syrup); (right) standards (track 1), Manuka (track 2) and spiked Manuka (from tracks 3–6 with the respective syrups from the left)
Literature
[1] C. Locher et al. J Planar Chromatogr (2017) 30(1):57–62.
[2] C. Locher et al. J Planar Chromatogr (2018) 31(3):181–189.
[3] M. K. Islam et al. J Planar Chromatogr (2020) 33(3):301–311.
[4] M. K. Islam et al. J Planar Chromatogr (2020) 33(5):489–499.
[5] M. K. Islam et al. Molecules (2020) 25(22).
Contact: Dr. Cornelia Locher, CRC for Honey Bee Products and Division of Pharmacy, School of Allied Health, University of Western Australia, Crawley, Western Australia, 6009, Australia, connie.locher[at]uwa.edu.au
An SST is commonly used in routine quality control to validate the performance of an analytical system, including the method and the apparatus. In chromatography, the SST is a process that analyzes the behavior of specific reference substances under certain chromatographic conditions to know whether the method is reproducible, robust, and suitable for the intended application. In HPTLC, the SST often qualifies only a limited region of the chromatogram (e.g., specific RF values or small RF ranges due to the need for having barely separable substances). If no deviation from the acceptance criteria is observed, the entire chromatographic system is considered compliant. However, in practice, the chromatographic quality of the other regions remains unknown. Additionally, HPTLC methods using developing solvents of different polarity and selectivity may require different sets of substances for SST. Some substances are costly and not readily available, which can increase the cost of analysis. To overcome these problems, a Universal HPTLC Mix (UHM) for use in SST was developed [1].
With the UHM, HPTLC laboratories have a single solution, applicable as SST to a wide range of chromatographic systems, with different polarities and selectivities. Its low price, stability in solution, and capability to detect small chromatographic variations make the UHM particularly attractive. The replacement of conventional substances for SST by the UHM will help laboratories to save time and money required for laborious investigation of specific reference substances for each method to be qualified. Different fields of application can benefit from the UHM concept, such as herbal drugs, forensics, pharmaceuticals, cosmetics, etc.
Standard solutions
Sulisobenzone, thymidine, paracetamol, 9-hydroxyfluorene and 2-(2H-benzotriazol-2-yl)-4-(1,1,3,3-tetramethylbutyl)phenol were prepared at 1 mg/mL. Guanosine is prepared at 0.5 mg/mL, thioxanthen-9-one at 0.01 mg/mL, and phthalimide at 2 mg/mL. All substances are dissolved in methanol.
HPTLC plates silica gel 60 F254 (Merck), 20 x10 cm are used.
2.0 μL of solutions are applied as bands with the Automatic TLC Sampler (ATS 4), 15 tracks, band length 8.0 mm, distance from left edge 20.0 mm, distance from lower edge 8.0 mm.
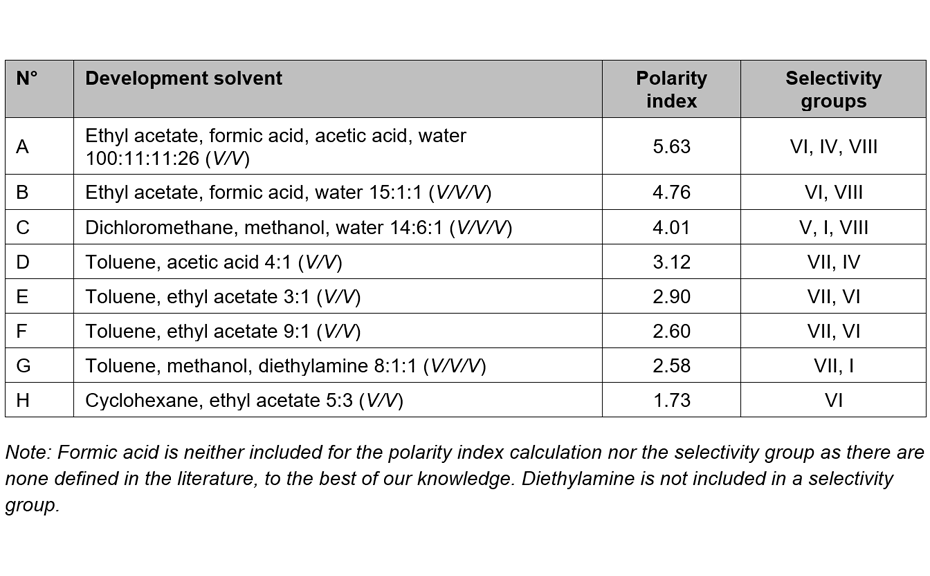
Plates are developed to 70mm(fromthe lower edge) in the ADC 2 with chamber saturation (20 min, with filter paper) and after activation at 33% relative humidity for 10 min using a saturated aqueous solution of magnesium chloride. 20 different developing solvents (eight of them are listed below) were investigated, followed by drying for 5 min.
Images of the plate are captured with the TLC Visualizer 2 at UV 254 nm and 366 nm.
Densitometry
Absorbance measurement at 254 nm and fluorescence measurement at 366 nm with TLC Scanner 4 and visionCATS, slit dimension 5.00 mm x 0.20 mm, scanning speed 20 mm/s. For the fluorescence measurement, a mercury lamp and a cut-off filter at 400 nm are used.
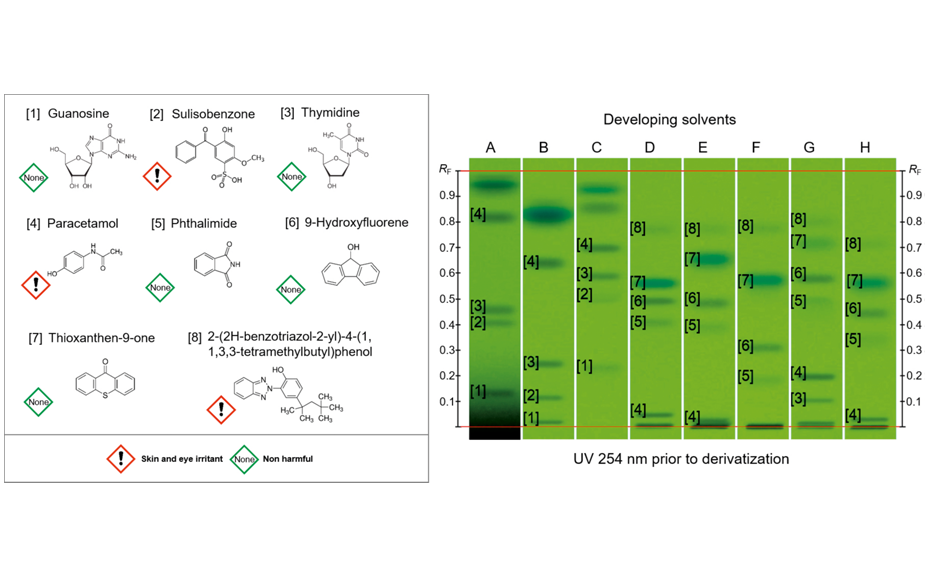
In the first step of the investigation, the suitable substances for the UHM were selected. The researchers [1] considered the following criteria, which lead to a list of 56 candidates: 1) Low hazard (not harmful and non-toxic substances); 2) Detectability at UV 254 and 366 nm prior to derivatization; 3) Stability in solution for at least two months; 4) Low cost (<50 CHF/g).
The chromatographic behavior of those 56 standards was evaluated with 20 developing solvents, covering a wide range of polarity and selectivity. The objective was to find a smaller group of substances that achieves an even distribution throughout the entire chromatogram for the maximum number of different developing solvents. Additionally, each developing solvent should achieve baseline separation for at least 3 – 4 substances. The chosen substances and their fingerprints in eight different developing solvents are shown in the following image.
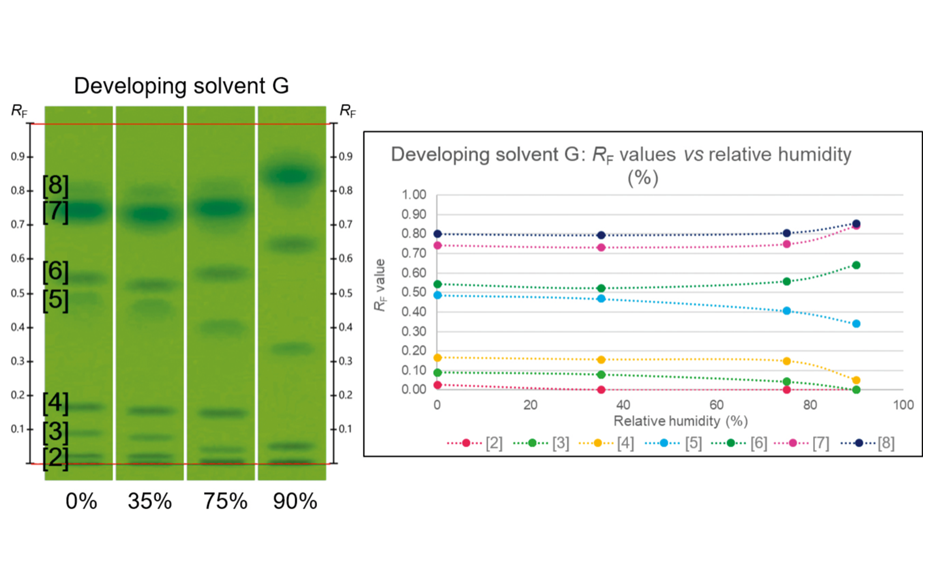
To evaluate, whether the UHM responds to variations of the chromatographic conditions, three experiments were performed. In the first, plates were conditioned to different relative humidity (from 0% to 90%) prior to development. As shown in the image below, the UHM is sensitive to variations in relative humidity, particularly to the higher ones. The differences are more expressive if the developing solvent contains no water.
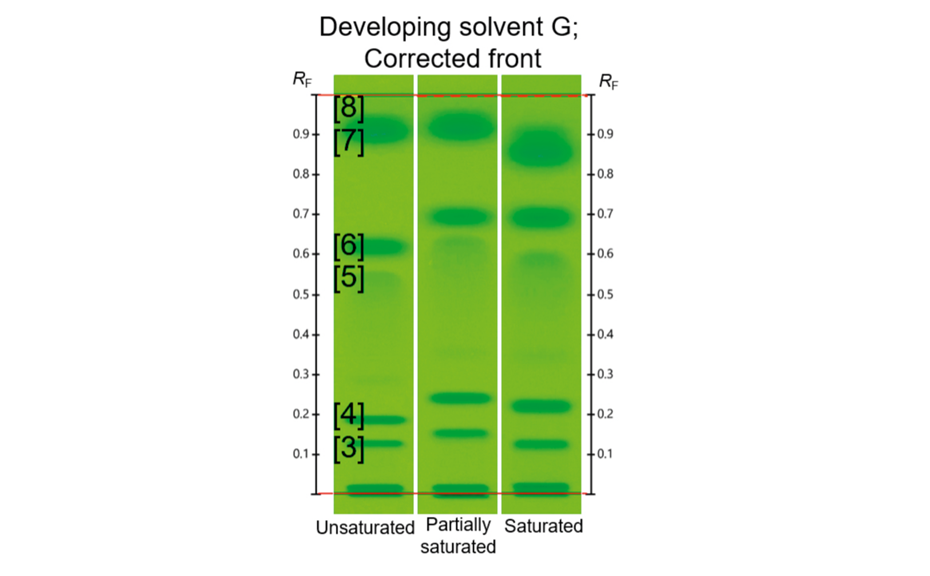
In the second experiment, the individual proportion of the solvents in developing solvents B and F was changed (±10%), and the effect on the chromatography was evaluated. A difference of up to 0.06 RF units was observed from the mean RF values of the control track. In the third experiment, different levels of chamber saturation were tested: unsaturated, partially saturated (20 min, no filter paper), and saturated (20 min, with filter paper). RF values increased with partial saturation, but then decreased with full saturation, proving that the UHM can detect chamber saturation problems.
The UHM performance was evaluated in intra- and inter-laboratory tests based on the ΔRF in developing solvents B, F and G. For the intra-laboratory test, the confidence interval ΔRF was 0.03, while for the inter-laboratory test, this value was 0.04.
01
Table 1
02
Substances selected for UHM and the HPTLC fingerprints of the UHM in eight different developing solvents
03
UHM evaluated with developing solvent G and conditioned to different relative humidities prior to development
04
UHM evaluated with developing solvent G developed with different levels of chamber saturation
[1] T. K. T. Do, M. Schmid, M. Phanse, A. Charegaonkar, H. Sprecher, M. Obkircher, E. Reich. Development of the first universal mixture for use in system suitability tests for High- Performance Thin-Layer Chromatography. J Chromatogr A, 1638 (2021). DOI: 10.1016/j.chroma.2020.461830.
Contact:
Dr. Tiên Do, CAMAG Laboratory, Sonnenmattstrasse 11, 4132 Muttenz, Switzerland, tien.do[at]camag.com
For more information about the Universal HPTLC Mix (UHM), please visit the Sigma-Aldrich website.
Gemmotherapy, also known as phytoembryotherapy, is an alternative phytotherapeutic treatment that uses extracts prepared mainly from the embryonic tissues of plants, e.g., emerging shoots and buds of various trees and shrubs. This type of therapy is used in European countries, such as Germany, France, Belgium, and Italy [1] [2]. The herbal drug is typically collected during spring, at the peak time of the tree’s or shrub’s germination. Gemmotherapy claims, that shoots and buds are exceptional parts of a plant in space and time. They develop substances not contained in the adult plants and provide high concentrations of minerals, vitamins, plant hormones, etc. [2]. It also claims to have higher biological activity in comparison to other traditional treatments with herbal drugs [2]. For preparation of the gemmotherapy medicines, the fresh buds or shots of the plant are macerated for 21 days with a mixture of alcohol and glycerine, at a ratio of 1:20 fresh plant material : mixture. The extracts are then filtered and diluted 1:10 with a mixture of glycerine, alcohol and water [3].
In her high school diploma work, Ms. Brunner qualitatively investigated the chemical differences between the fingerprints of the buds and mature leaves of four herbal drugs used in gemmotherapy: birch (Betula pubescens EhRh.), hazel (Corylus avellana L.), ash (Fraxinus excelsior L.), and dog rose (Rosa canina L.). Samples of each specimen have been collected at different germination periods between spring (when sprouting started) and summer of 2019 (mature leaves). The focus of the investigation was on secondary metabolites, which are generally considered as active principle of herbal drugs. Ms. Brunner was honoured with the “Simply Science” prize of the “Schweizer Jugend forscht” contest in 2020 [4].
Standard solutions
System Suitability Test (SST): verbascoside and quercitrin are prepared in methanol at concentrations of 1 mg/mL and 0.5 mg/mL, respectively.
Sample preparation
After collection, the samples are kept in the freezer to preserve freshness. Prior to extraction, any ice crystals on the frozen buds or leaves are removed mechanically. Then, the material is cut into small pieces with a knife. For the extraction, 500 mg of the cut material are mixed with 5mL of methanol and sonicated for 10minutes at room temperature. The mixture is centrifuged for 5 minutes and the supernatant is used as test solution.
Chromatogram layer
HPTLC plates silica gel 60 F254 (Merck), 20 x10 cm
Sample application
Automatic TLC Sampler (ATS 4), 15 tracks, band length 8.0 mm, track distance 11.4 mm, distance from left edge 20.0 mm, distance from lower edge 8.0 mm, application volume 2.0 μL
Chromatography
In the ADC 2 with chamber saturation for 20 min (with filter paper) and after conditioning at 33% relative humidity for 10 min using a saturated solution of magnesium chloride, development with ethyl acetate, formic acid, water (15:1:1 v/v/v) to 70 mm (from the lower edge), drying for 5 min
Post-chromatographic derivatization
The plate is heated at 100 °C for 3 min using the TLC Plate Heater, immersed into natural product (NP) reagent (1.0 g of 2-aminoethyl diphenylborinate dissolved in 200 mL of ethyl acetate) dried under cold air and documented. Subsequently, the plate is immersed into anisaldehyde-sulfuric acid (AS) reagent (1.0mL of p-anisaldehyde dissolved in 200 mL of a mixture of methanol, acetic acid and sulfuric acid 17:2:1 (v/v/v)) and then heated at 100 °C for 3 min.
Documentation
TLC Visualizer 2 under UV 254 and UV 366 nm (prior to derivatization), UV 366 nm (after derivatization with NP reagent) and white light (after derivatization with NP plus AS reagents)
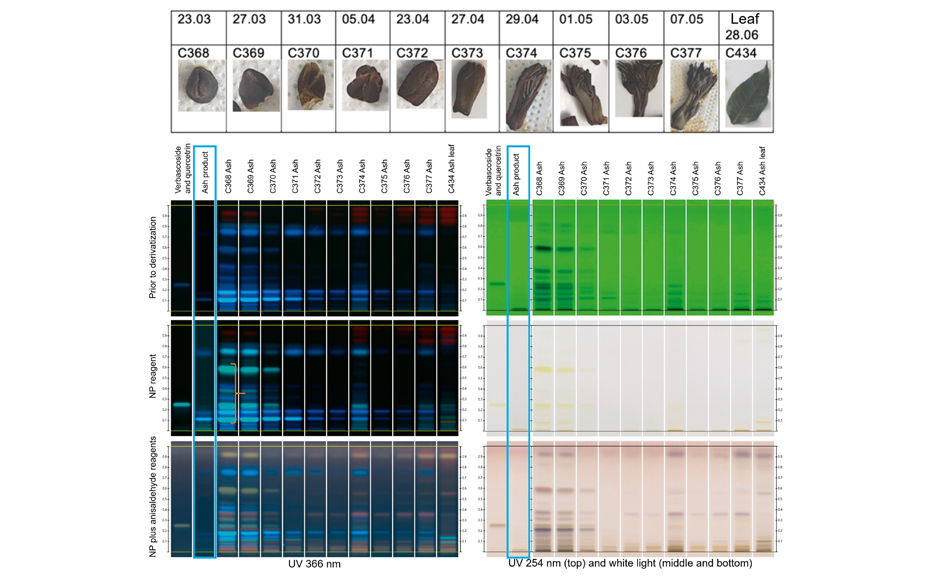
HPTLC analyses of birch, ash, hazel and dog rose samples were performed with samples from three individual plants of each species, collected in the Basel area in Switzerland. The buds and leaves of these plants were gathered eleven times between March and June of 2019. Results are shown in the figures below and are reported for one individuum of ash and dog rose. Their fingerprints were compared to those of the respective gemmotherapy products.
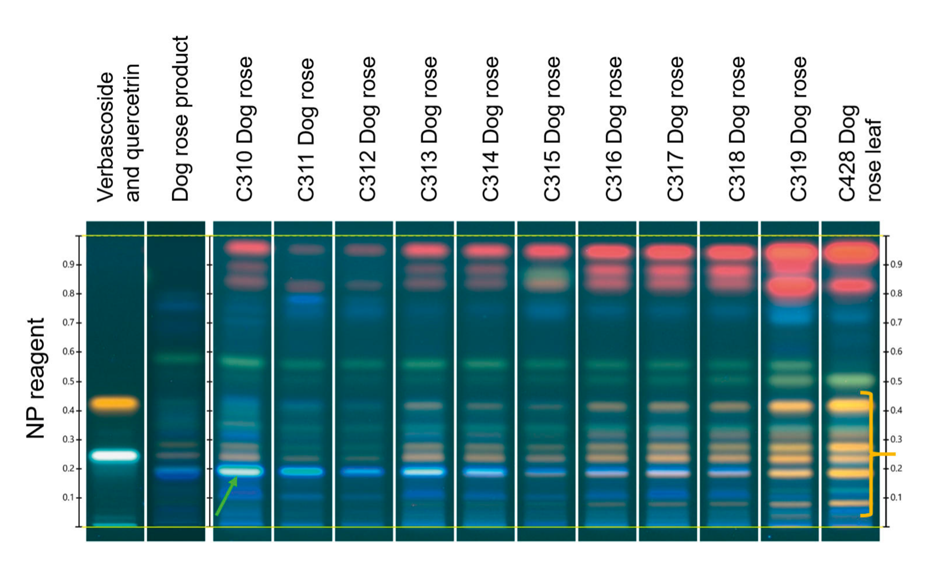
The following observations were made: first, the fingerprints of the buds are very different from those of the mature leaves, e.g., the young bud of ash (C368) and its respective mature leaf (C434), under several detections (see shown figures). Second, the younger buds contain generally a higher concentration of secondary metabolites than buds with first shots (leaves) or, in some cases, the matured leaves. For example, samples of young bud of ash (C368, C369, C370) show several blue intense zones under UV 366 nm after derivatization with NP (orange bracket), corresponding to hydroxycinnamic acid derivatives, not seen in the subsequent samples. Third, the transition from buds to young leaves is generally paralleled by a gradual change in the composition of the fingerprints. For example, the more mature the buds, the lower the content of hydroxy-cinnamic acid derivatives. In the case of dog rose, a decrease is observed in the content of hydroxy-cinnamic acid derivatives (green arrow) accompanied by an increase in the number of zones corresponding to flavonoids (yellow zones, yellow bracket).
The fingerprints of commercial gemmotherapy products show similarities with those of the buds, but fingerprints are generally fainter (e.g. blue frame). This was expected, because the products are usually prepared in a diluted form, following the homeopathic philosophy.
Additional experiments will be performed to investigate the variation in the composition more quantitatively and to remove the freezing process prior to extraction, in order to copy the industrial preparations for gemmotherapy.
01
Images and fingerprints of ash bud and leaf under different detections,collected between March and June
02
Fingerprints of dog rose bud and leaf collected between 23 March and 28 June, under UV 366 nm after derivatization with NP reagent
[1] A.-D. Raiciu, “Gemmotherapy – Modern Medicine,” in Proceedings, 2019, vol. 29, p. 117.
[2] A. Sarkova and M. Sarek, “EAV and Gemmotherapy – Medicine for the Next Millennium? (technique as a means to link eastern and western medicine),” in Engineering in Medicine and Biology 27th Annual Conference, 2005, pp. 4943–4946.
[3] Seroyal, “Gemmotherapy. Embryonic tissue extracts to stimulate organ systems toxin elimination toward the emunctories,” Reference guide. [Online]. Available: https://www.seroyal.com/media/wysiwyg/seroyal/downloads/Gemmotherapy_Brochure.pdf. (accessed: 17.07.2020).
[4] https://sjf.ch/arbeiten-nationaler-wettbewerb/ (accessed: 20.07.2020)
Contact:
Débora Frommenwiler, CAMAG, Sonnenmattstrasse 11, 4132 Muttenz, Switzerland, debora.frommenwiler[at]camag.com
The Swiss Centre for Applied Ecotoxicology (Ecotox Centre) is the Swiss competence center for applied, practice-oriented ecotoxicology. It serves as the primary knowledge hub and discussion platform for research and development, consulting and education in that area (https://www.ecotoxcentre.ch). The Ecotox Centre has expertise in developing bioassay screening tools for environmental chemical mixtures and product leachates, and therefore is interested in new ways of analyzing complex samples. The current project, supported by the Swiss Food Safety and Veterinary Office and in collaboration with the Zurich University of Applied Sciences (Dr. Andreas Schönborn), is evaluating and applying HPTLC-based methods for the biological detection and subsequent identification of chemicals in food packaging and drinking water.
Chemicals migrating into food from packaging materials can include unknown substances. To detect potentially toxic chemicals, we employ bioassays of effects including endocrine disruption. Bioassays such as the yeast estrogen screen (YES) are typically performed in 96-well microtiter plates (ISO standard [1]). Yeast cells modified for the YES produce ß-galactosidase upon induction of the embedded human estrogen receptor. This induction is ultimately quantified by monitoring ß-galactosidase-catalyzed production of colored or fluorescent substances.
In contrast to testing whole mixtures in microtiter plates, separation on HPTLC plates with subsequent bioassay detection has the potential to reveal multiple toxic chemicals, and help identify responsible entities. The planar-YES (P-YES) has been used to screen various samples on HPTLC plates [2–4], but there has been little to no comparison to the official method. Herein, the P-YES and the microtiter YES were compared in their sensitivity to screen for endocrine active compounds related to food packaging materials.
Standards are prepared in ethanol at concentrations based on range-finding tests in both the P-YES and L-YES. Nine concentrations of each test chemical are prepared in 2-fold dilution series for application onto HPTLC plates.
Sample preparation
Chemical migration from coated metal cans is simulated according to European Commission guidelines for fatty foods [5]. Briefly, cans are loaded with 95% ethanol, sealed, and incubated at 60 °C for 10 days. Duplicate samples of three different can types are prepared simultaneously. Ninety-five percent ethanol in duplicate glass beakers mimick sample handling as negative controls. Migrates are concentrated under nitrogen to be tested in the bioassays at up to 2.4 mL migrate equivalents.
HPTLC plate silica gel 60 (Merck), 20 x 10 cm, pre-washed with methanol
Automatic TLC Sampler (ATS 4), application as bands, 15 tracks, band length 6.0 mm, distance from left edge 20.0 mm, at least 12.0 mm track distance, for tests without development, application in three rows at 15.0, 42.5, and 70.0 mm from the bottom of the plate, for tests with development, application at 8.0 mm from the lower edge, application volume of 5.0 μL for estradiol E2 standard solution, 20.0 μL for all other standard solutions and 40.0 μL of migrate samples, application of full concentration series (nine concentrations) of E2 and two test chemicals to each plate (n = 3)
AMD 2 development (isocratic) up to 80 mm with chloroform – acetone – petroleum ether 11:4:5 [4], followed by drying for 5 min with vacuum
Editor’s note: Development in the ADC 2 is also possible for this application.
P-YES
The bioassay is performed by spraying 2 mL yeast cells (McDonnell) [4] at 1000 ± 200 formazine attenuation units onto HPTLC plates (Derivatizer; red nozzle, spraying level 6) followed by incubation at 30°C for 3 hours. Then, plates are sprayed with 2 mL 0.5 mg/mL 4-methylumbelliferyl-ß-D-galactopyranoside (MUG) in buffer (Derivatizer; blue nozzle, spraying level 6), and incubated for 20 min at 37 °C.
TLC Visualizer under white light and UV 366 nm
Microtiter bioassay (L-YES)
The L-YES (YES test assisted by enzymatic digestion with lyticase) is performed according to ISO standard [1]. Briefly, yeast cells are exposed to standard chemicals and samples in 96-well microtiter plates for 18 hrs. Detection occurred by monitoring cleavage of chlorophenol-red-ß-galactopyranoside.
Data analysis
Bioassay responses (peak height of fluorescence measurements for P-YES or absorbance at 540 nm for L-YES) are normalized to the maximum response of E2 and modelled in a four-parameter log logistic function. Median and 10 percent effective doses (ED50, ED10) are predicted with 95% confidence intervals.
Our goal was to compare the P-YES with the standardized L-YES as a screening method for estrogenic effects of substances from food packaging. Towards that aim, we determined effect concentrations for 20 chemicals relevant to plastic packaging and screened example migrates of food packaging with both assays. Our interest was in the technical difference of the bioassays in microtiter plates on HPTLC plates. Therefore, we determined effective doses thoroughly without performing chromatography. This allowed us to eliminate chromatography as a factor in any differences we would see between the assays and increase the sample capacity on the plates. Separately, we also examined the effect of chromatography on model chemicals E2 and bisphenol A (BPA).
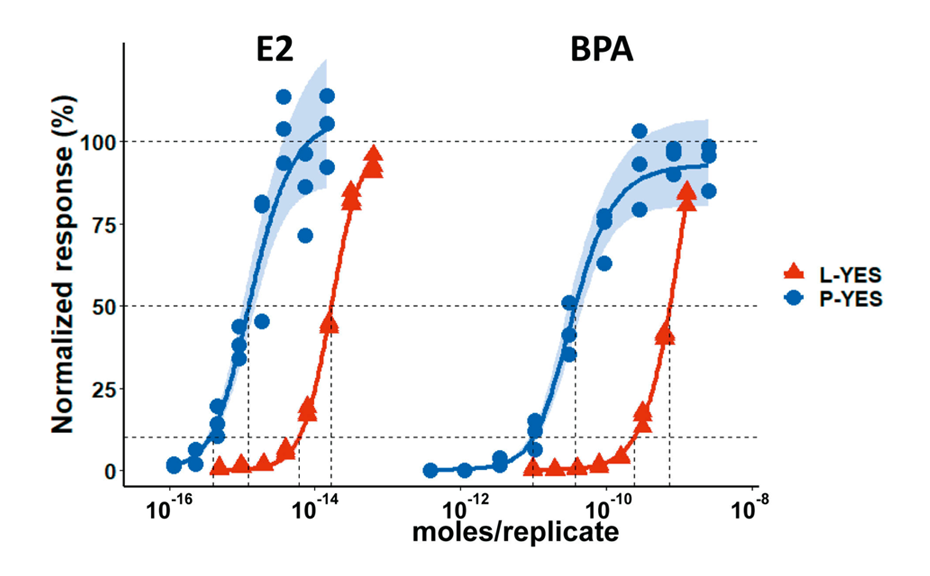
Dose responses of E2 and BPA are shown for the P-YES (without development) and L-YES. The doses producing 10% of the maximal E2 response (ED10) interpolated from the dose response curves were lower for the P-YES than the L-YES. This demonstrates greater sensitivity of the P-YES. We also examined assay parameters such as strain of yeast and indicator solution [6]. They were not able to explain the difference in sensitivity.
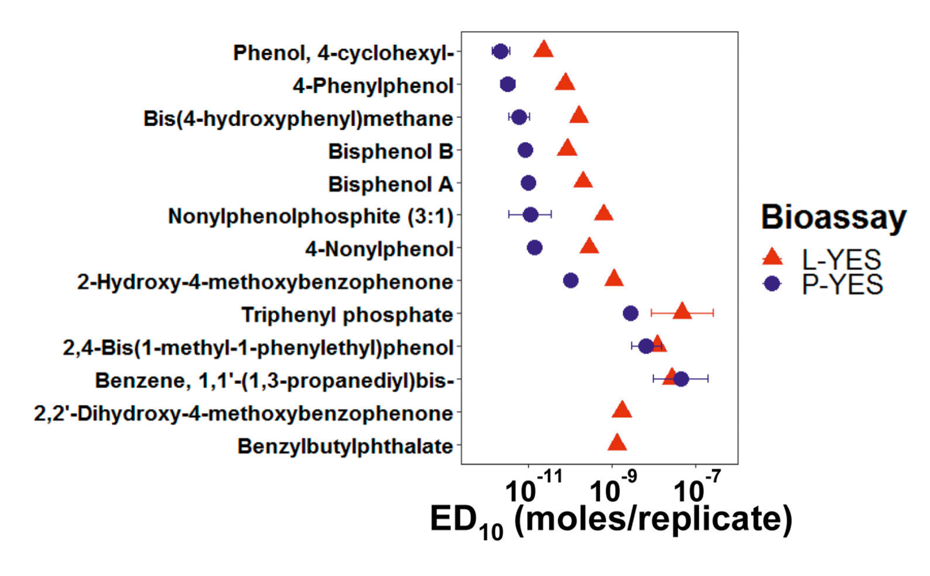
Thirteen of 20 chemicals were active at levels reaching at least 10% of the maximum E2 response. The ED10 of most of these chemicals were lower in the P-YES than the L-YES. This demonstrates that the P-YES is generally more sensitive than the L-YES, although that trend started to break down as potency of the chemicals decreases (higher EDs). The potency of each chemical relative to E2 is within a factor of two of its corresponding relative potency in the L-YES.
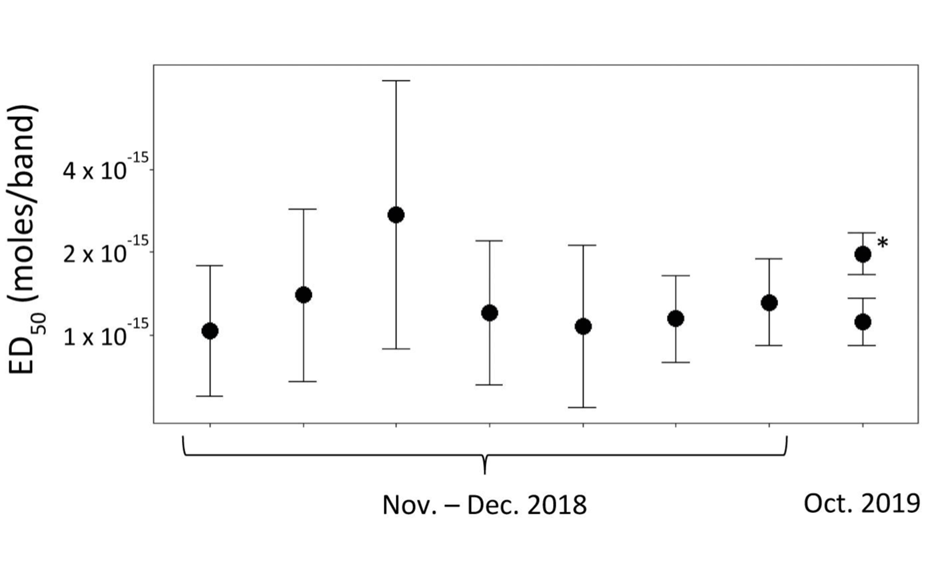
The P-YES is stable over time. We were able to obtain the same ED50 for E2 after one year.We also evaluated the effect of chromatographic development as shown with an asterisk. With tight 95% confidence intervals, the ED50 is different than without development on the same day. However, both with and without development were within historical variability of the P-YES without development. The historical range is consistently lower than for the L-YES (median L-YES ED50 > 1 x 10-14).
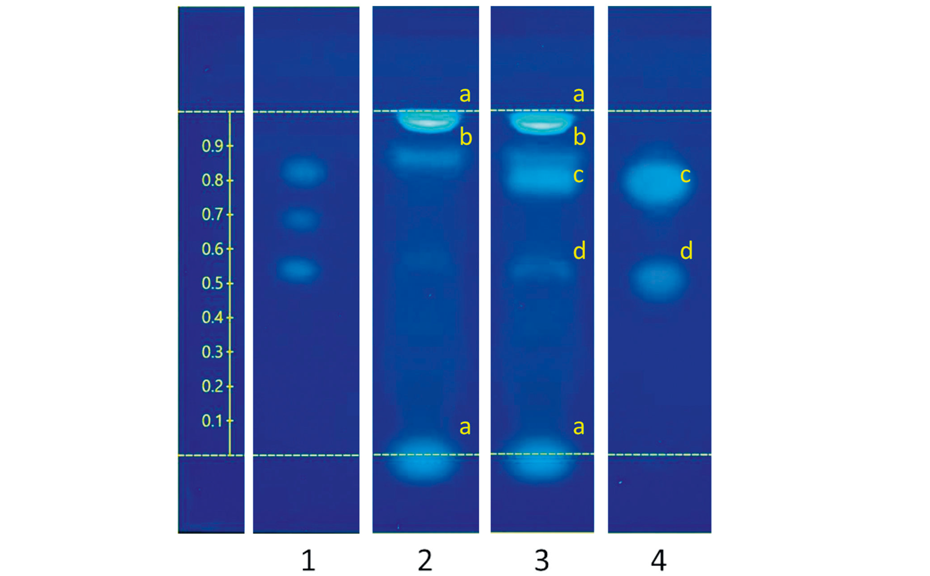
An example migrate of a metal can tested in the P-YES is shown below. This migrate had no estrogenic effect in the L-YES but did result in reduced cell growth. An estrogenic band of (an) unknown substance(s) in the migrate was revealed by testing with the P-YES. Spiked chemicals were also detectable in the migrate. BPA was detected at a concentration of 27 ng (1.2 x 10⁻¹⁰ mol), which is lower than would be required to detect BPA at its specific migration limit (2 μg, 8 x 10⁻⁹ mol/band) given the sample preparation used in this study.
This study showed that
01
Dose response curves of E2 and BPA: P-YES (without development) measured in fluorescence at 366 nm illumination and L-YES measured in absorbance at 540 nm; shaded regions exhibit the modelled 95% confidence intervals; horizontal dotted lines show the 10, 50, and 100% effect levels; vertical dotted lines indicate the corresponding ED
02
The ED10 of chemicals that activated the estrogen receptor. Error bars (95% confidence interval of predicted value, dose response modeling based on triplicate plates) are often obscured by the data markers; replicate is a band in P-YES, and a microtiter well in L-YES. 2,2’-dihydroxy-4-methoxybenzophenone and benzylbutylphthalate produced a fluorescence response in P-YES but did not reach a 10% effect level. Reproduced with modifications from [6] (https://creativecommons.org/licenses/by/4.0/legalcode)
03
Repeatability of the median effective dose (ED50) of the reference chemical E2, over time in P-YES without development. Experiment days are shown that were performed within one month of each other, and up to a year later. Asterisk (*) indicates test with development (n=3). Reproduced from [6] (https://creativecommons.org/licenses/by/4.0/legalcode)
04
Detection of estrogen-active compounds in a migrate of a food contact material. Retention factor (RF) shown on left axis. Application position and the solvent front indicated by lower and upper dashed lines, respectively. Track 1: mixture of E2 (1 pg), 17∝-ethinylestradiol (1 pg), and estrone (10 pg) with increasing RF values, track 2: migrate of metal can, track 3: spiked migrate of metal can, track 4: spiked control migrate; samples on track 3 and 4 spiked with BPA (27 ng), benzophenone- 3 (140 ng), and estrone (0.2 ng); Zones marked with (a) native fluorescence of chemicals (i.e. not estrogenicity), (b) native estrogenicity, (c) co-eluting spiked chemicals estrone and benzophenone-3, (d) BPA.
[1] ISO. 19040-1. Water quality — Determination of the estrogenic potential of water and waste water — Part 1: Yeast estrogen screen (Saccharomyces cerevisiae), Geneva, Switzerland (2018)
[2] I. Klingelhofer, G.E. Morlock. Anal Chem (2015) 87(21):11098–104
[3] S. Buchinger et al. Anal Chem (2013) 85(15):7248-56
[4] A. Schoenborn et al. J Chromatogr A (2017) 1530:185-91
[5] European Commission. Commission Regulation (EU) No 10/2011 on plastic materials and articles intended to come into contact with food, Official Journal of the European Union (2011)
[6] A. J. Bergmann et al. Anal Bioanal Chem (2020) 412: 4527–4536
Contact:
Dr. Alan Bergmann, Swiss Centre for Applied Ecotoxicology, Eawag, Überlandstrasse 133, 8600 Dübendorf, Switzerland, alanjames.bergmann@oekotoxzentrum.ch
The development of straightforward and simple HPTLC methods for the characterization and determination of the food emulsifiers E471 and E472 in dairy products is one of the research topics of Dr. Claudia Oellig at the Department of Food Chemistry and Analytical Chemistry (170a); directed by Prof. Dr. Michael Granvogl (Institute of Food Chemistry, University of Hohenheim, Stuttgart, Germany). This study presents a method for the characterization of E472 emulsifiers by HPTLC fingerprints and the identification of separated constituents by mass spectrometry.
Esters of fruit acids as well as mono- and diacylglycerols (MAG and DAG) are often used as additives in foodstuff to adjust its techno-functional properties. Due to their surface-active properties, they are listed as emulsifiers, more precisely as E472 food emulsifiers. They are usually added to food products to regulate stability and viscosity, and, for example in dairy products, to adjust foaming and emulsion stability. Regulation (EC) No 1333/2008 approves fruit acid esters of MAG and DAG as food additives and categorizes them into six groups based on the respective acids [1]. The main categories comprise acetic acid esters (ACETEM, E472a), lactic acid esters (LACTEM, E472b), citric acid esters (CITREM, E472c), and mono- and diacetyl tartaric acid esters (DATEM, E472e). These emulsifiers are very complex and widely varying mixtures of fruit acid esters of MAG and DAG, along with MAG, DAG, and further constituents. Because techno-functionality strongly depends on the emulsifier’s composition, reliable and easy to perform analytical methods are of great interest to control the product quality. In the presented characterization of E472, the cost-effective and efficient HPTLC provides fast results for many samples in parallel, wherein the fingerprint technique allows immediate visual evaluation of the samples [2].
The characterization of E472 food emulsifiers through HPTLC fingerprints was successfully developed and applied to several samples of the categories ACETEM (E472a), LACTEM (E472b), CITREM (E472c), and DATEM (E472e). After dissolving in tert-butyl methyl ether, emulsifiers were directly applied onto normal phase HPTLC silica gel and separated with a two-fold development. Derivatization with primuline allowed for visualization and easy comparison of fluorescent lipid classes under UV 366 nm. Coupling to mass spectrometry offers fast identification of prominent constituents of the complex emulsifier mixtures.
Sample and standard solutions
Samples of E472 emulsifiers (ACETEM, LACTEM, CITREM, and DATEM) are dissolved in tert-butyl methyl ether (tBME) at a concentration of 1 mg/mL. A standard-mix solution containing mono-, di-, tristearin, and stearic acid (MSt, DSt, TSt, and SA) is prepared at 0.125 μg/μL, respectively.
HPTLC silica gel 60 F254s MS plates (Merck), 20 x 10 cm
With the Automatic TLC Sampler (ATS 4) as 6.0 mm bands, 18 tracks, track distance 10.0 mm, distance from the left plate edge 15.0 mm, distance from the lower plate edge 8.0 mm, application volume 10.0 μL for samples and standard for visual characterization by fingerprint and 75.0 μL for samples for identification by mass spectrometry, drying in a fume hood for 10 m
In the Automatic Developing Chamber (ADC 2) with chloroform – methanol – water – formic acid 670:80:19:2 for the first development, migration distance 50 mm, drying time 10 min and with n-heptane – diethyl ether – formic acid 55:45:1 for the second development, migration distance 80 mm, drying time 5 min, plate activation for 5min at 33% using a saturated solution of magnesium chloride before each of the developments
Post-chromatographic derivatization
The plate is immersed into a solution of primuline (0.05% in acetone – water 4:1) with the Chromatogram Immersion Device (immersion speed 1 cm/s, immersion time 3 s) and dried for 5 min in a stream of warm air.
Documentation
With TLC Visualizer under UV 366 nm
Mass spectrometry
Zones are eluted with the TLC–MS Interface (oval elution head) at a flow rate of 0.2 mL/min with methanol – 0.1% formic acid 9:1 for 40 s into a single quadrupole mass spectrometer equipped with an electrospray ionization interface (positive ionization, scan mode).
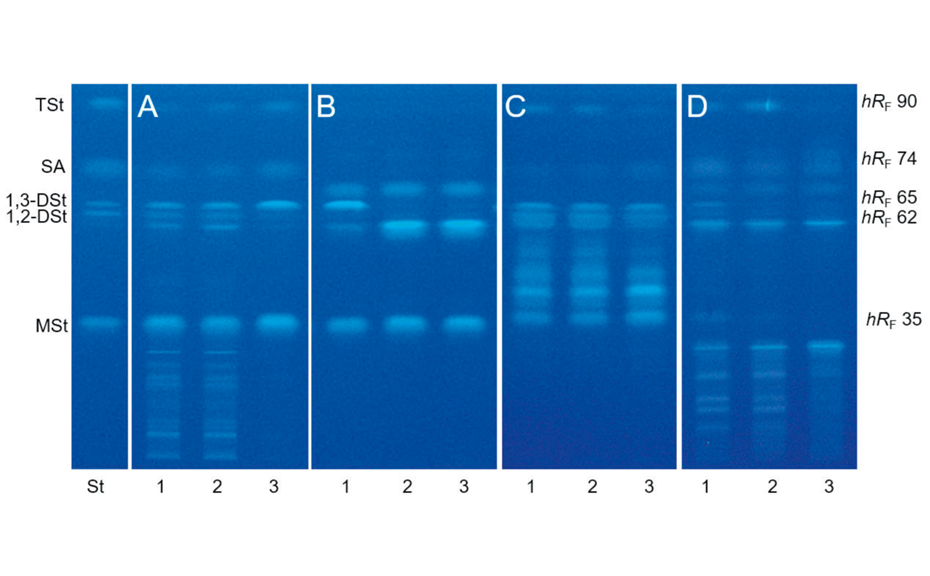
The visual characterization and comparison of E472 food emulsifiers were performed by the straightforward HPTLC fingerprint technique. Food emulsifiers were simply dissolved in tBME and directly used for HPTLC. A two-fold development on HPTLC silica gel with chloroform – methanol – water – formic acid 670:80:19:2 for the first development and n-heptane – diethyl ether – formic acid 55:45:1 for the second development offered suitable separation of the constituents for the investigated E472 categories. The fingerprint under UV 366 nm directly visualized differences between the categories and the complexity of the classes comprising numerous components. For the compounds of the lipid classes MSt, 1,2-DSt, 1,3-DSt, SA, and TSt, hRF values of 35, 62, 65, 74, and 90 were obtained. CITREM showed citric acid esters in the hRF range 0–35, ACETEM acetic acid esters in the hRF range 60–74, LACTEM lactic acid esters in the hRF range 35–62, and DATEM different fruit acid esters in the ranges 0–35 and 60–74. Thus, the fingerprint allows to distinguish between emulsifier categories and to determine variations within the same category of E472.
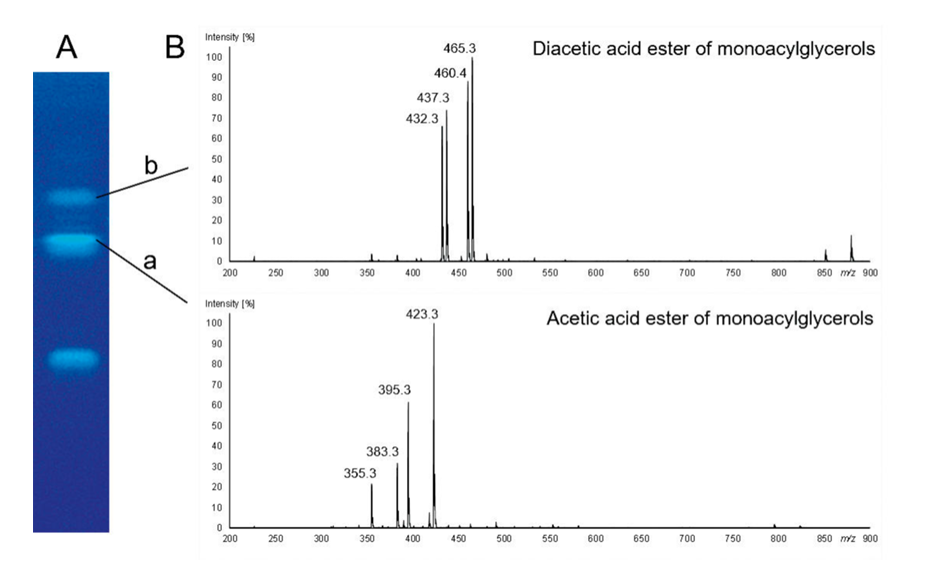
Direct hyphenation with mass spectrometry provided mass specific information and offered the identification of individual components. Thus, more detailed information on the emulsifier’s composition was obtained. Hence, the coupling to mass spectrometry offered the identification of prominent zones (components) of the categories and of zones (components) that differ in the visual fingerprint between batches or formulations. In addition, deviations in the emulsifier’s composition that might occur during storage can be identified.
In summary, the fingerprint technique is a fast tool to determine the emulsifier’s composition, and to relate differences in the composition to differences in the detected techno-functional properties and the dosage of emulsifiers in the product. In addition, this elegantmethod can be used for simple and efficient quality control of incoming commercial emulsifiers, for example in the dairy industry.
01
HPTLC fingerprint of E472 emulsifiers under UV 366 nm. Different batches (1–3) of (A) CITREM, (B) ACETEM, (C) LACTEM, and (D) DATEM with an amount of 10 μg emulsifier/zone and a (St) standard-mix containing MSt, 1,2-DSt, 1,3-DSt, SA, and TSt (1.25 μg/zone) for comparison.
02
Identification of constituents of E472 emulsifiers by HPTLC–MS. (A) HPTLC separation of an ACETEM emulsifier (75 μg/zone) and (B) corresponding mass spectra extracted from the total ion current chronogram of the zones a and b after coupling toMS with the TLC–MS Interface and ESI+–MS analysis. Modified from [2].
[1] The European Parliament and the Council of the European Union, Regulation (EC)No 1333/2008 of the European Parliament and of the Council of 16 December 2008 on food additives, 2008.
[2] Oellig et al., J Chromatogr A (2020) 460874.
Contact: Dr. Claudia Oellig, Department of Food Chemistry and Analytical Chemistry (170a), Institute of Food Chemistry, University of Hohenheim, 70599 Stuttgart, Germany, claudia.oellig[at]uni-hohenheim.de
The Métabolome et Valorisation de la Biodiversité Végétale (MVBV) team of the Institut de Chimie de Nice (Université Côte d’Azur, France) is directed by Prof. Xavier Fernandez who works in the field of natural products analysis. Together with BotaniCert, an analytical laboratory directed by Dr. Francis Hadji-Minaglou and specialized in the analysis and authentication of plant material, the MVBV team has been working on a collaborative project to find new natural preservatives in Mediterranean plant species for the cosmetic industry.
Plant extracts offer a large source of bioactive molecules. Most often, the screening for bioactivity is performed with the dilution method in 96 well plates. The major disadvantage of this method is the lack of information on the chemical class and number of active constituents of the extract. HPTLC is a widely employed technique for testing of natural products, e.g. identification and test for adulteration. Since the last decade, a growing interest in HPTLC hyphenated with bioassays (HPTLC-EDA) has been noted [1].
For a simplified identification of active ingredients in plant extracts we have chosen HPTLC bioautography. Due to the combination of chromatographic separation and effect-directed analyses, HPTLC allows to directly localize active ingredients, avoiding a time-consuming bio-guided fractionation. Up to 15 extracts can be analyzed at the same time. In our study, Aspergillus brasiliensis has been selected to screen for antifungal active ingredients. Positive compounds can be promising candidates as natural preservatives for cosmetic products.
Standard solutions
Glycyrrhizic acid, quercetin and rutin (0.5 mg/mL in methanol)
Sample preparation
Dry plant material is grounded and macerated in ethanol 75% (plant volume/solvent volume 1:10) for 2 h at room temperature. After centrifugation the supernatants are used as test solutions.
Chromatogram layer
HPTLC plate silica gel 60 F254 (Merck), 20 x 10 cm
Sample application
Automatic TLC Sampler (ATS 4), application as bands, 15 tracks, band length 8.0 mm, distance from left edge 20.0 mm, distance from lower edge 8.0 mm, application volume 20.0 μL for samples and 2.0 μL for standards
Chromatography
In the ADC 2 with chamber saturation with filter paper 20 min and after activation at 33% relative humidity for 10 min using a saturated solution of magnesium chloride, development with ethyl acetate – water – acetic acid – formic acid 100: 26:11:11 to the migration distance of 70 mm (from the lower edge), drying for 5 min
Post-chromatographic derivatization
Editor’s Note: in many cases a sequential derivatization with first NP reagent and then with anisaldehyde reagent on the same plate is possible. The fluorescence enhancer (PEG) is then not used.
Bioautography with Aspergillus brasiliensis
The plate is conditioned with the culture broth (Sabouraud), then manually sprayed with a suspension of spores of A. brasiliensis at 105 spores/mL, and incubated at room temperature (25°C) 48 h to 72 h.
Documentation
TLC Visualizer under UV 254 nm, UV 366 nm, and white light
Results and discussion
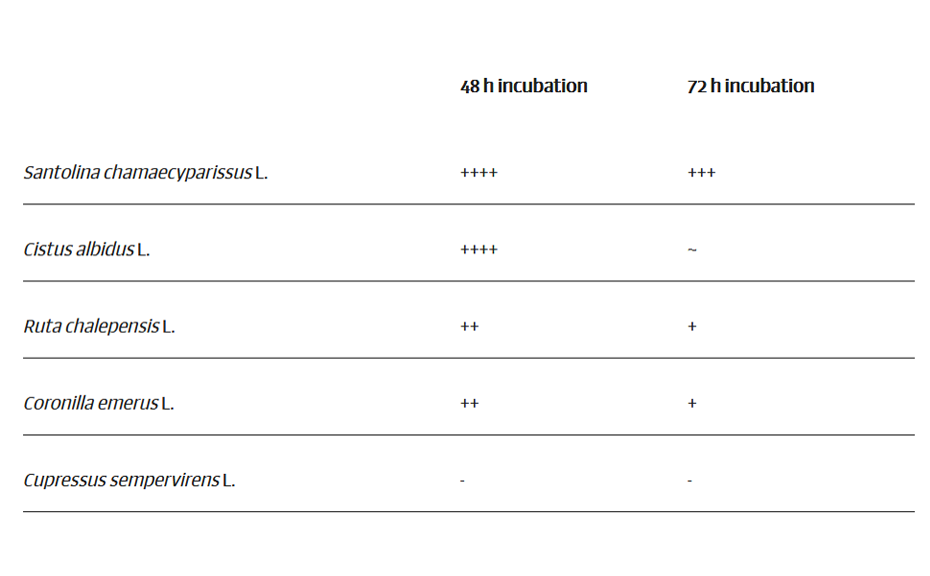
The antifungal capacity of five Mediterranean plants (Santolina chamaecyparissus L., Asteraceae, flowering top; Cistus albidus L., Cistaceae, branches; Ruta chalepensis L., Rutaceae, top; Coronilla emerus L., Fabaceae, flowering top; Cupressus sempervirens L. Cupressaceae, branches) was studied using A. brasiliensis to discover new natural preservatives for the cosmetic industry. First, the raw extracts were screened following the dilution method in 96 well plates.
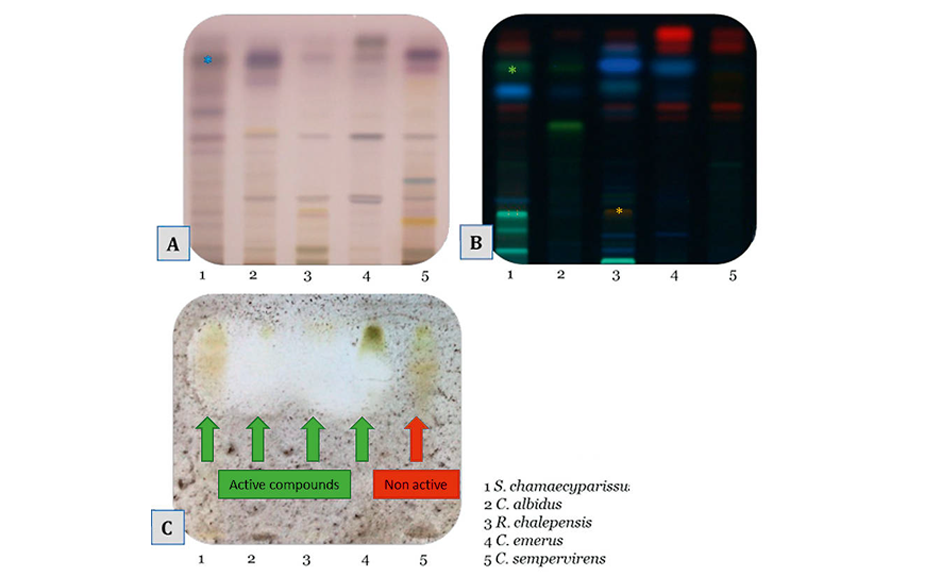
Afterwards, in order to determine the family of compounds responsible for the antifungal activity, HPTLC bioautography was performed on the extracts.
Except for C. sempervirens, the tested plants showed antifungal activity on the plate. Positive zones are located on top of the plates where unpolar compounds migrate. Terpenoids (purple zones after derivatization with anisaldehyde) and unpolar polyphenols (greenish-yellow zones after derivatization with NP-PEG) seem to bear the antifungal activity. C. sempervirens L. has no antifungal property as shown on the dilution assay.
Further investigations [2] on Santolina chamaecyparissus L. extract led to the isolation and NMR identification of the active compound spiroketalenol ((5S,7Z)-7-(hexa-2,4-diyn-1-ylidene)-1,6-dioxaspiro [4.4]nona-2,8-dien-4-yl acetate). Therefore, Santolina extract seems to be a good candidate as a new natural preservative for cosmetics.
01
Antifungal activity against A. brasiliensis: +++: antifungal activity 90–100%; ++: 70–90%; +: 60–70%; ~: 40–60%; –: ≤ 40%
02
HPTLC chromatograms under white light after derivatization with anisaldehyde-sulfuric acid reagent (A, *glycyrrhizic acid, track 1), under UV 366 nm after derivatization with NP-PEG (B, *quercetin, track 1, *rutin, track 3), and under white light after incubation with A. brasiliensis (C)
[1] G. Morlock et al. J Chromatogr A 1217 (2010) 6600
[2] A. Kerdudo et al. C R Chimie 19 (2016) 1077
Contact: Prof. Xavier Fernandez, MVBV, Institut de Chimie de Nice, 28 avenue Valrose, 06108 Nice Cedex 2, France, xavier.fernandez[at]univ-cotedazur.fr
The subject of this article brings together two researchers who have a common interest in specialized metabolites involved in plant chemical defenses. Dr. Thomas Michel is analytical chemist at the Institute of Chemistry of Nice (Université Côte d’Azur, Nice, France) where he develops analytical tools for chemical ecology and for discovery of bioactive compounds from plant biodiversity. He employs HPTLC for analytical goals and TLC for preparative separations. Dr. Anne- Violette Lavoir, ecologist at the Institute Sophia Agrobiotech (INRAe, Université Côte d’Azur, Antibes, France) works on the chemical interaction between plants and insects (community ecology, chemical ecology). In this work, the authors employed HPTLC for secondary metabolites screening of different plant extracts in an ecological context.
Ecosystems are complex systems, forming a vast network in which different actors – the living beings – interact with each other. The main trophic network is the “green world” [1,2], in which the chlorophyllous plants are the primary producers. They bring organic matter and energy into the network through the fixation of mineral matter by photosynthesis. In this green world, fresh plants are the basis as they are consumed by herbivores, which will in turn be consumed by predators. The “brown world” [1,2] is based on the litter, mostly formed from plant parts (e.g. leaves, bark, stems) that dry out and fall to the ground (inert organic matter). The litter is consumed by detritus feeders (or decomposers), which will then also be consumed by their predators. As litter are previously fresh leaves, the basis of the green and brown world is linked through the so-called plantlitter continuum.
A change in plant or litter chemistry would impact not only their consumers, but all the trophic levels above. For instance, plants could modify their chemical defenses such as secondary metabolites, impacting all their consumers. Because of the plant-litter continuum, any modification in the chemistry of the fresh plants will in turn modify the chemistry of the litter and consequentially the brown trophic network.
In this context, we studied the variation in content of secondary metabolites at five stages of the plant-litter continuum (young plants, mature plants, fresh litter, old litter and decomposer feces), from four plant species (Bromus erectus, Pilosella officinarum, Potentilla grandiflora and Sanguisorba minor). Each stage and plant species were sampled by our collaborators on grasslands of Les Causses (South of France) and each grassland was either fertilized or not. Our main objective was to compare the global chemistry of the four plant species throughout the plant-litter continuum and to see if the fertilization may modify such pattern.
The great diversity of phytochemicals and their small quantities in plant species, and the number of samples to investigate led us to set up a large-scale HPTLC analysis. HPTLC was chosen because it offers numerous advantages such as versatility, capacity to run several samples in parallel and low solvent consumption. Additionally, detection using various derivatization reactions can provide crucial information about the nature of chemical substances present in samples. Furthermore, sample preparation in HPTLC is simple while other chromatographic techniques (e.g. GC and HPLC) usually require a time-consuming and expensive sample preparation prior to the analyses. Therefore, HPTLC is suitable as a high-throughput fingerprinting method in an ecological context.
Standard solutions
Quercetin, asiaticoside and betuline are dissolved in methanol at different concentration levels.
Sample preparation
20mg of ground plant are extracted in an ultrasonic bath with 1.6 mL ethanol – water 7:3. Extracts are then filtered and stored at –20 °C before HPTLC analysis.
Chromatogram layer
HPTLC plates silica gel 60 F254 (Merck), 20 x10 cm
Sample application
Automatic TLC Sampler (ATS 4), application as bands, 16 tracks, band length 8.0 mm, distance from left edge 15.0 mm, distance from lower edge 8.0 mm, application volume 2.0 μL for sample solutions and 2.0 μL for standard solutions
Chromatography
In the Automatic Developing Chamber (ADC 2) with ethyl acetate – formic acid – acetic acid – water 100:11:11:26 (polyphenols), chloroform – methanol – water 5:4:1 (glycosylated terpenoids), or hexane – ethyl acetate – water 4:1:0.5 (hydrophobic terpenoids) after chamber saturation (filter paper) and activation at 33% relative humidity for 10 min using a saturated solution of magnesium chloride, migration distance of 70 mm (from the lower edge), drying for 5 min
Post-chromatographic derivatization
All plates are immersed into specific reagents for 2 s using the Chromatogram Immersion Device. For phenolic compounds, the plate is immersed into NP reagent (1.25 g diphenyl borinic acid ethylamino ester in 250 mL of ethyl acetate) and then into PEG reagent (10% polyethylene glycol 400 in dichloromethane). For terpenoids, the plate is immersed into anisaldehyde-sulfuric acid reagent (0.5 mL anisaldehyde, 10 mL glacial acetic acid, 85 mL methanol, 5 mL sulfuric acid) and heated on the TLC Plate Heater at 105 °C for 5 min.
Documentation
TLC Visualizer under UV 254 nm, UV 366 nm, and white light
Densitometry
TLC Scanner 4 and winCATS, slit dimension 5.00 mm x 0.20 mm, scanning speed 50 mm/s, spectra recording from 190 to 450 nm, measurement after derivatization in fluorescence mode at 366/>400 nm with Hg lamp (polyphenols), in absorbance mode at 400 nm (polar terpenoids), and at 600 nm (apolar terpenoids) with tungsten lamp, evaluation via peak area and calibration curves of specific compounds (i.e. quercetin, asiaticoside, betuline)
Statistical analyses
Data are statistically analyzed by a Scheirer-Ray- Hare test using R software.
Results and discussion
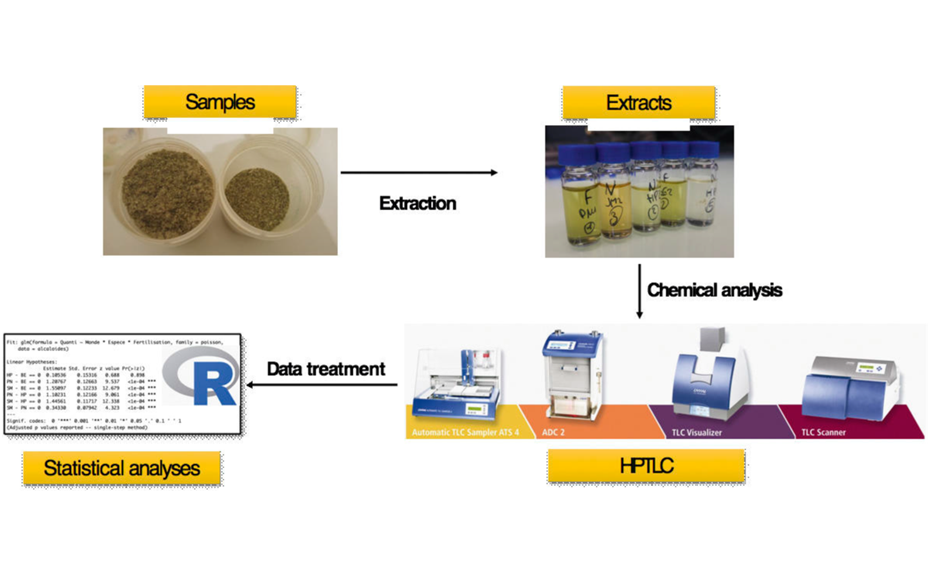
To analyze and compare the diversity of the phytochemicals (i.e. polyphenols, terpenes, alkaloids) of the four plant species, the first step was to develop a suitable analytical workflow and to optimize the chromatographic conditions for separation of the different compound families.
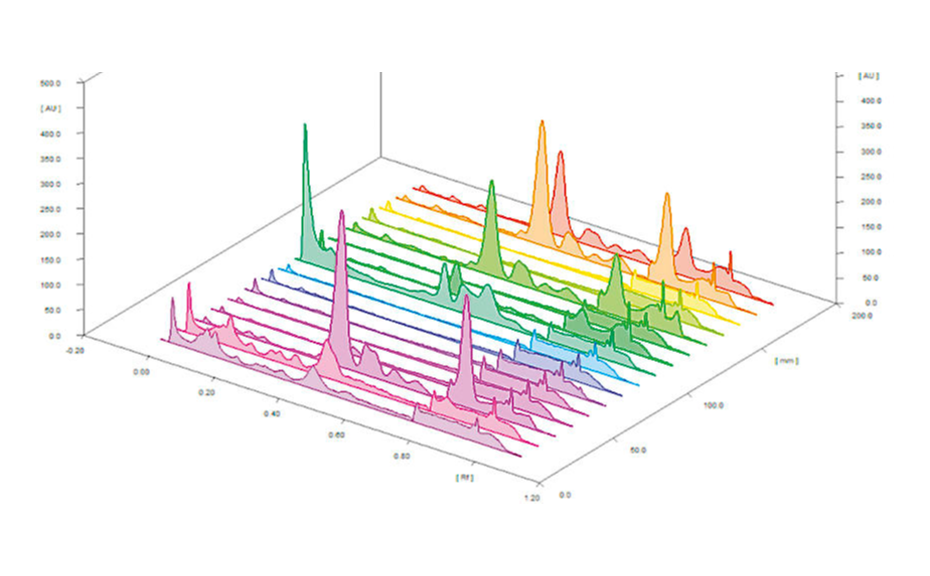
Quantitative estimation of each class of compounds was further performed by scanning densitometry. A typical HPTLC densitogram obtained at 366 nm after derivatization with NP reagent is shown below. The area under each peak was determined and compared to the calibration curves of specific compounds (e.g. quercetin for polyphenols). Results are then expressed in mg standard/g dry matter.
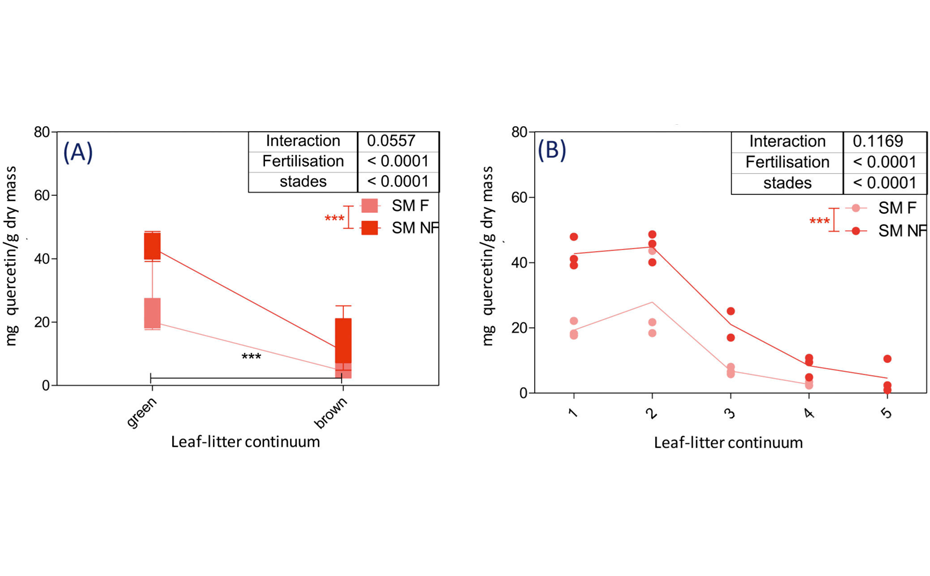
For example, relative quantity of polyphenols (mg of quercetin/g dry mass) in Sanguisorba minor samples significantly decreases between the green and the brown world (p<0.0001). No significant differences were observed between samples from the same world (e.g. young and mature plant). On the contrary, the effect of fertilization is significant for both green and brown worlds (p < 0.0001). Polyphenols are more present in fertilized samples than in unfertilized ones.
Using this HPTLC strategy, we were able to estimate the relative quantity of polyphenols (i.e. mg quercetin/g dry matter) and terpenoids (e.g. mg betulin/g dry matter) according to the plant species, to the stages in the plant-litter continuum and to the fertilization status. Furthermore, this strategy was also applied to tannins, terpenoids, and alkaloids (data not shown), giving us the possibility of a complete screening of secondary metabolites in all plant species studied. The complete results enable the determination of the evolution of secondary metabolites in the fresh plant-decomposed litter continuum:
To conclude, this HPTLC strategy allowed us to highlight modifications of the plant secondary metabolites throughout the plant-litter food web but also to observe a link between the green and the brown world. Interestingly, even though plants show various strategies, we always observe a decrease of concentrations in the brown world. As secondary metabolites are mainly defense compounds, we hypothesize a decrease of such compounds in the leaf before they fall in order to recycle such compounds and/or to avoid a negative impact on detritus feeders which are consuming the litter. Analyzing the plant chemistry throughout the plant-litter continuum helps us to disentangle the complexity and the link structuring the green and brown worlds.
01
Analytical workflow used to extract, separate and quantify secondary metabolites of different plant species
 02
02
Typical HPTLC densitogram of samples obtained at 366/>400 nm after derivatization with NP reagent
03
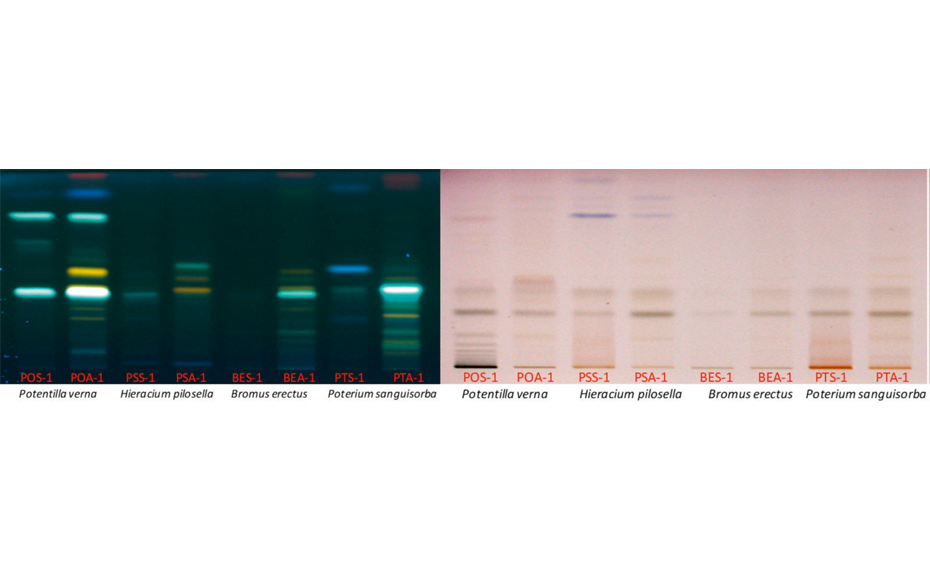
Typical HPTLC fingerprints of the four analyzed plant species (above- and belowground samples) under UV 366 nm after derivatization with NP/PEG reagent and under white light after derivatization with anisaldehydesulfuric acid reagent (POS-1 = Potentilla grandiflora below, POA-1 Potentilla grandiflora above, PSS-1 = Pilosella officinarum below, PSA-1 = Pilosella officinarum above, BES-1 = Bromus erectus below, BEA-1 = Bromus erectus above, PTS-1: Sanguisorba minor below, PTA-1: Sanguisorba minor above)
04
Relative quantity of polyphenols in mg of quercetin/g dry mass in the leaflitter continuum of Sanguisorba minor. 1-young plant; 2-mature plant; 3-fresh litter; 4-decomposed litter; 5-faeces; green world gathers stages 1 and 2, brown world gathers stages 3 and 4; F: fertilized; NF: non-fertilized
[1] Wardle et al. Science (2004), 304, 1629
[2] Wolkovich et al. Ecology (2014), 95–12
Contact: Dr. Thomas Michel, Université Côte d’Azur, CNRS, Institut de Chimie de Nice UMR 7272, 06108 Nice, France, thomas.michel[at]univ-cotedazur.fr
Acknowledgement: The authors acknowledge all the partners involved in the EC2CO COMODO project funded by CNRS (supervision: S. Coq), especially Florian Goettelmann and Louisa Saghir for their respective works.