The research team at the University of Western Australia (UWA), Division of Pharmacy, in collaboration with the Cooperative Research Centre for Honey Bee Products Limited (CRC-HBP) develops a HPTLC based real-time honey assessment tool for beekeepers and packers to determine a honey’s floral source alongside the collation of key phytochemical parameters and bioactivity data for a wide range of Australian honeys. The team currently also investigates potential correlations between phytochemical characteristics of honeys and their bioactivity. Using HPTLC as a qualitative and quantitative honey analysis tool, they monitor changes over time, and caused by storage and handling conditions. Moreover, a HPTLC based method for the detection of sugar syrup adulterants in honey has also recently been developed.
Introduction
Honey is derived from nectar collected by honey bees from a range of floral sources. After collection, numerous processes take place outside and also within the hive, such as exposure to bee related enzymes and removal of moisture, which ultimately convert the nectar into honey. Honey can be considered a complex natural product, consisting of a high amount of sugars (>70%), residual moisture (typically 17–20%) and a small portion (approx. 3%) of non-sugar constituents, including minerals, vitamins, protein, phenolics and flavonoids. These minor constituents are directly related to the honey’s nectar source and thus play a critical role in the authentication of honeys. They also influence the honey’s organoleptic and physicochemical characteristics as well as its level of bioactivity. Antioxidant activity is linked to high concentrations of phenolics, phenolic acids, anthocyanins, hydroxycinnamic acid derivatives and flavonoids. DPPH* (2,2-diphenyl-1- picrylhydrazyl, C18H12N5O6) is a powerful radical used for the antioxidant screening of compounds, mixtures of constituents, extracts and biological matrices, such as wine, fruit juices, salivary secretions and plant extracts, and also, as demonstrated in this study, honey.
The phytochemical composition of honeys depends on the floral nectar source and thus on the geographic origin and time of harvesting. It might also be influenced by processing and storage conditions, by the bee species collecting the nectar and the bee enzymes the nectar and honey come in contact with. Despite this complexity, honeys from the same floral species present characteristic constituent patterns, which can be used in the authentication of their floral source. These patterns can be effectively captured by HPTLC analysis of honeys’ organic extracts and can thus assist in the authentication of their floral origins.
As a major source of energy, carbohydrates, including simple sugars such as glucose, fructose, sucrose, maltose or galactose, play an important role in human nutrition. The determination of their content in various botanical products and food items is therefore of interest. However, the quantification of simple sugars is not without challenges due to their high polarity, low volatility and lack of a sizeable chromophore. Furthermore, these sugars are often found in complex matrices, which require their separation from proteins, fats, and / or minerals as well as other matrix constituents prior to analysis.
Herein, three different methods for the analysis of honey samples are presented. Method A is suited for the honey floral source identification by HPTLC fingerprinting, method B enables a fast assessment of antioxidant zone activity, and method C allows to quantify sugars and to detect sugar adulterants in honey.
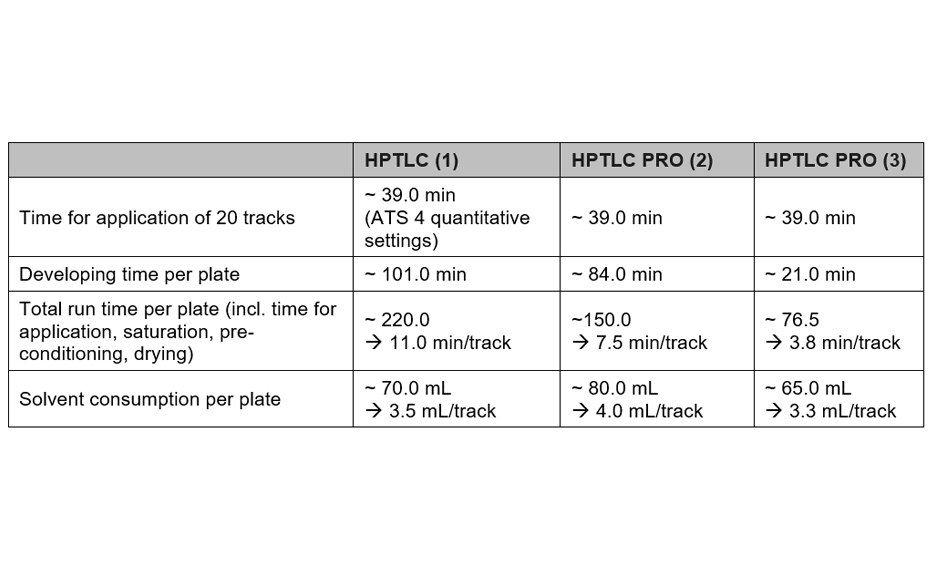
The developed authentication method (A) is rapid, reliable, and repeatable and can therefore be used as a convenient analytical tool in routine honey quality control. The method involves a simple solvent extraction step followed by a short chromatographic development time (9 –10 min). It requires minimal solvent and reagent input while allowing the simultaneous analysis of up to 14 samples on a single plate. HPTLC-DPPH analysis (B) is advantageous over traditional assays which measure the total antioxidant activity, as it can detect individual active compounds and quantify their respective contribution to the overall antioxidant effect. The analytical approach is easy and fast to perform and powerful in visualizing antioxidant compounds. Further, their respective< activity can be quantified as gallic acid equivalents, even if their chemical identity is unknown. The developed method for sugar analysis (C) is convenient and easy to perform in a single development step with minimal sample pre-treatment. Moreover, only small sample quantities (approx. 100 mg) and small volumes of development solvent (approx. 35 mL) are needed for the analysis of multiple samples in a single run, which makes the method also a very cost effective approach to easily detect and quantify major sugars in honey.
Standard solutions
(A) Reference solution of 4,5,7-trihydroxy-flavanone (0.5 mg/mL) is prepared in methanol. (B) Standard stock solution of gallic acid (20 μg/mL) is prepared in methanol. (C) Standard glucose, fructose, sucrose and maltose solutions (250 μg/mL) are prepared in 50% aqueous methanol with sonication.
Sample preparation
(A and B) Manuka, Jarrah, Banksia and Marri honeys, and a honey of an unidentified floral source referred here as UNF (Supermarket honey; unidentified floral origin); 1 g of each honey is mixed with 2 mL of deionized water, then extracted three times with 5 mL of dichloromethane. The combined organic extracts are dried at ambient temperature and reconstituted in 100 μL of dichloromethane prior to analysis. (C) Two honeys (Manuka and Jarrah); four different sugar syrups (Maple, Corn, Golden, and Glucose); and artificially adulterated Manuka and Jarrah honey with four different sugar syrups at 30% concentration. The sample solutions (1 mg/mL) are prepared using 50% aqueous methanol.
Chromatogram layer
HPTLC glass plates silica gel 60 F254 (Merck) 20 x10 cm are used.
Sample application
With the Linomat 5 between 1.0 –7.0 μL of the standard and 3.0 –5.0 μL of each sample solution are applied as 8 mm bands at 8 mm from the lower and 20 mm from the left edge of the HPTLC plate (dosage speed 150 nL/s for A and B and 50 nL/s for C).
Chromatography
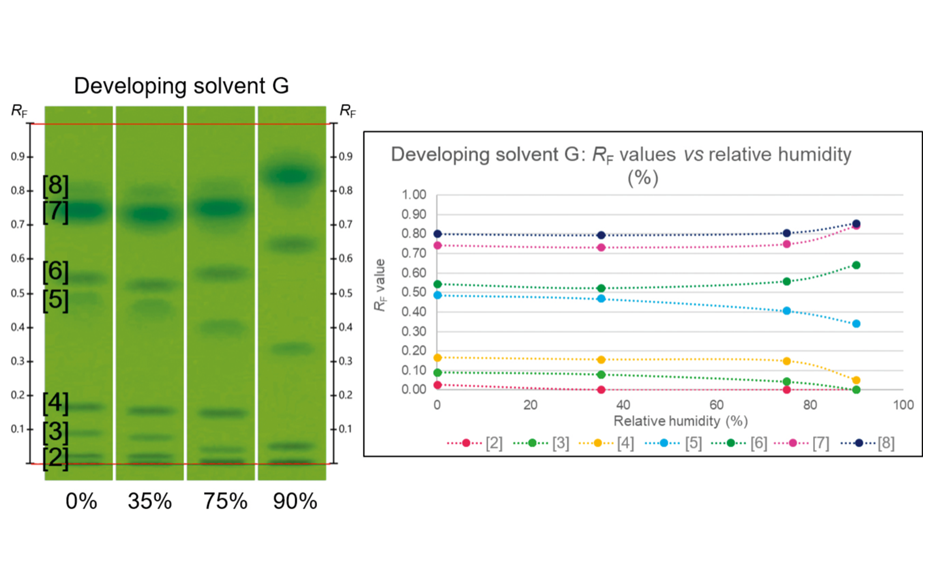
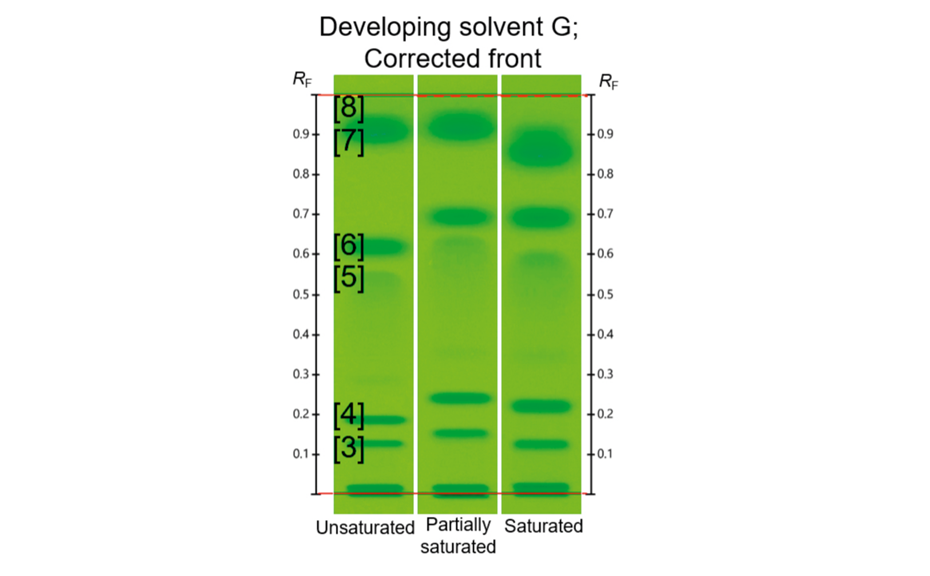
(A and B) With the Automatic Development Chamber (ADC 2) the plates are conditioned to 33% relative humidity, pre-conditioned for 5 min, and developed to a distance of 70 mm in a saturated chamber (20 min for saturation). The developing solvent is toluene – ethyl acetate – formic acid 6:5:1 (v/v) [1, 2, 3]. Plates are dried for 5 min in the ADC 2. (C) With the Automatic Development Chamber (ADC 2) the plates are conditioned to 33% relative humidity, pre-conditioned for 5 min, and developed to a distance of 85 mm in a saturated chamber (60 min for saturation). The developing solvent is 1-butanol – 2-propanol – aqueous boric acid (5 mg/mL) 30:50:10 (v/v/v) [5]. Plates are dried for 5 min in the ADC 2.
Post-chromatographic derivatization
(A) The plates are derivatized with 3.0 mL of vanillin reagent using the Derivatizer (yellow nozzle, level 3) and heated for 3 min at 115 °C using the TLC Plate Heater. (B) The plates are derivatized with 2.0 mL of 0.4% DPPH reagent using the Derivatizer (yellow nozzle, level 1). (C) The plates are derivatized with 2.0 mL of aniline – diphenylamine – phosphoric acid reagent using the Derivatizer (yellow nozzle, level 5). The derivatized plates are heated for 10 min at 115°C using the TLC Plate Heater.
Documentation
With the TLC Visualizer 2 at UV 254 nm and UV 366 nm after development (A) and in white light (A, B*, C) and UV 366 nm (A) after derivatization (for B 60 min after reagent transfer).
Results and discussion
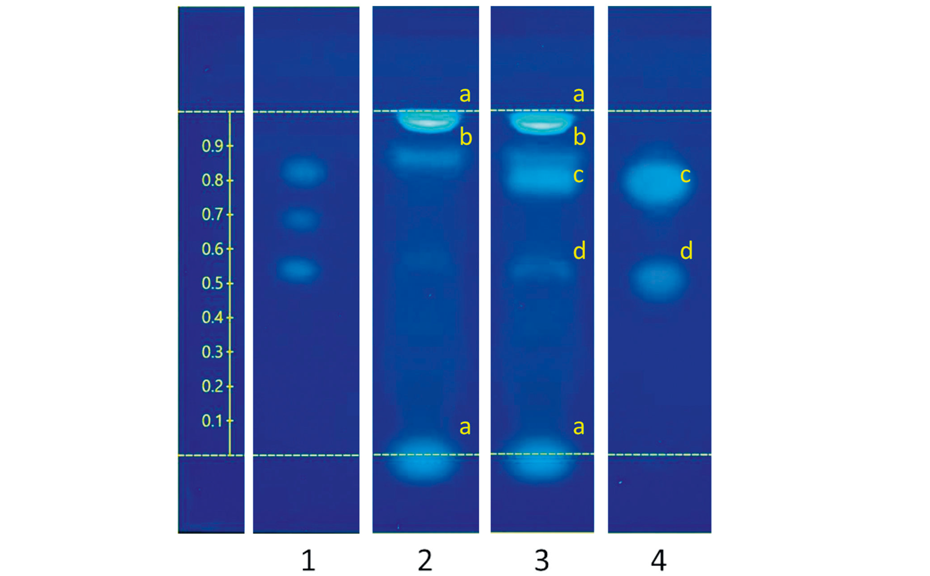
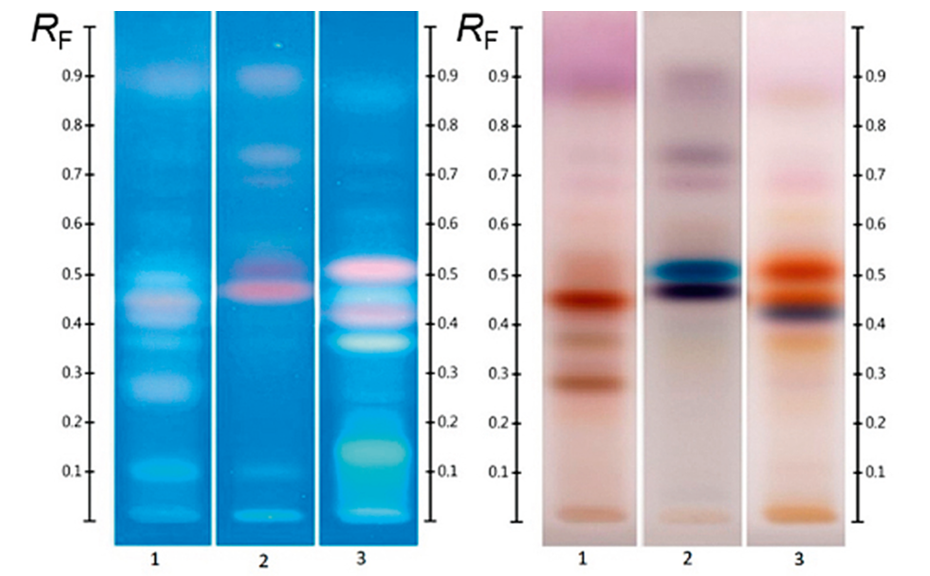
(A) Figure 1 shows the HPTLC fingerprints of three different honeys, labelled as Jarrah, Banksia and Marri, obtained at UV 366 nm and white light after derivatization. The two sets of images show a unique pattern for each honey within a RF range of 0.05 to 0.60, representative of each honey’s specific fingerprint.
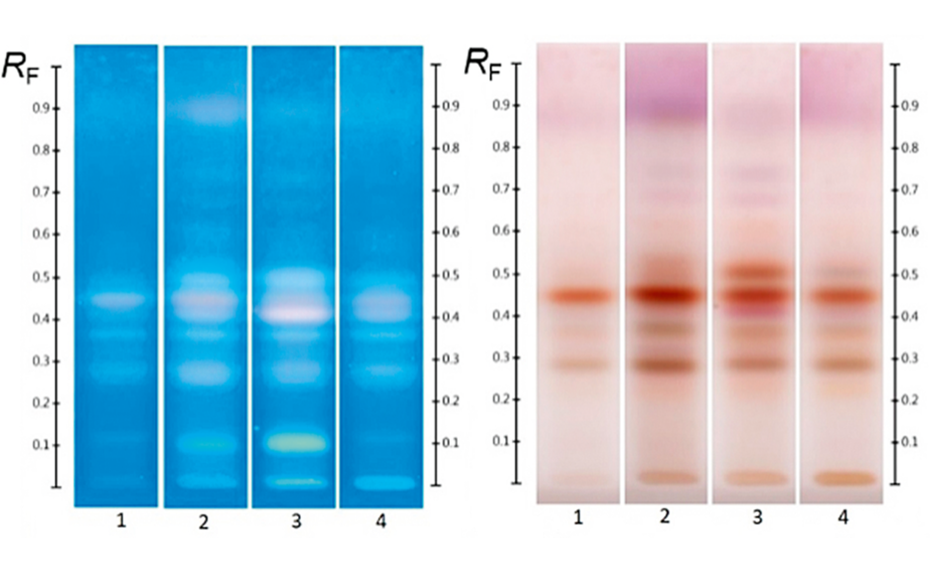
Four different honeys, all purchased labelled as Jarrah honeys, were analyzed at UV 366 nm and at white light after derivatization (Figure 2). Though obtained from different suppliers, all honeys share common zones between RF 0.05 to 0.60 in their fingerprint, which can serve as a convenient authentication tool.
As a natural product, the composition of honey, even when derived from the same floral nectar, can be expected to exhibit some natural variation between samples. In order to obtain a representative fingerprint and to limit the impact of natural variation on the effectiveness of the method as an authentication tool, individual samples were pooled to produce an ‘average’ fingerprint, in which major deviations from the norm were ‘diluted out’ and key compounds, representative of the floral source across all samples, were amplified.
The effectiveness of this approach is demonstrated in Figure 3 where a pooled HPTLC fingerprint captures the key features of five individual samples, all labelled as Manuka honey. Slight variations present in the Manuka samples (e.g. zones at RF 0.41 at UV 366 nm after development and at RF 0.55 and RF 0.38 at UV 366 nm after derivatization, as well as individual zone intensities, which correspond to compound concentrations) are no longer evident in the pooled fingerprint.
(B) After derivatization, the plate background appeared dark pink, reflecting the color of DPPH* in its reduced state. Where constituents with antioxidant activity reacted with DPPH*, the intensity of the background color was diminished, visualizing compounds with antioxidant zone activity. The stronger the antioxidant activity, the brighter white the active zone appeared against the pink background. Gallic acid was detected on the plate at RF 0.29 after derivatization.
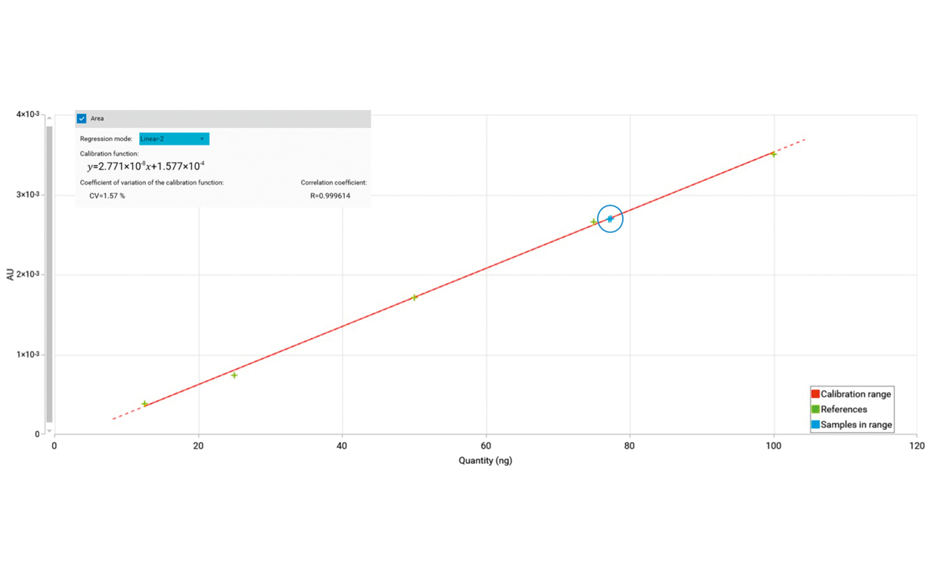
For the quantitative analysis of antioxidant zone activity of honey as gallic acid equivalents, the obtained images were converted into peak profiles (PPI), which were used to derive calibration curves of absorbance vs concentration. Using the trend line equations from the calibration curves, the LOD and LOQ were found to be 16.5 ng and 50.0 ng for gallic acid in honey and 14.3 ng and 43.3 ng for pure gallic acid in methanol [3]. As there were no noticeable differences between the LOD and LOQ of gallic acid in methanol and in the honey matrix, it could be concluded that the honey matrix did not have an interfering effect.
The accuracy of the method (expressed as mean recovery) was within 99.9 to 101.5%. Precision (intra-day and inter-day) and repeatability expressed as standard deviation (SD) and %RSD were between 0.69 and 2.29 (SD) and between 1.01 and 3.07% (%RSD). Repeatability was found to fall within a range of 0.49 – 1.83 (SD) and 0.60 – 2.25% (%RSD). The above parameters were all within the International Conference on Harmonization (ICH) guidelines and, thus, confirmed the validity of the method.
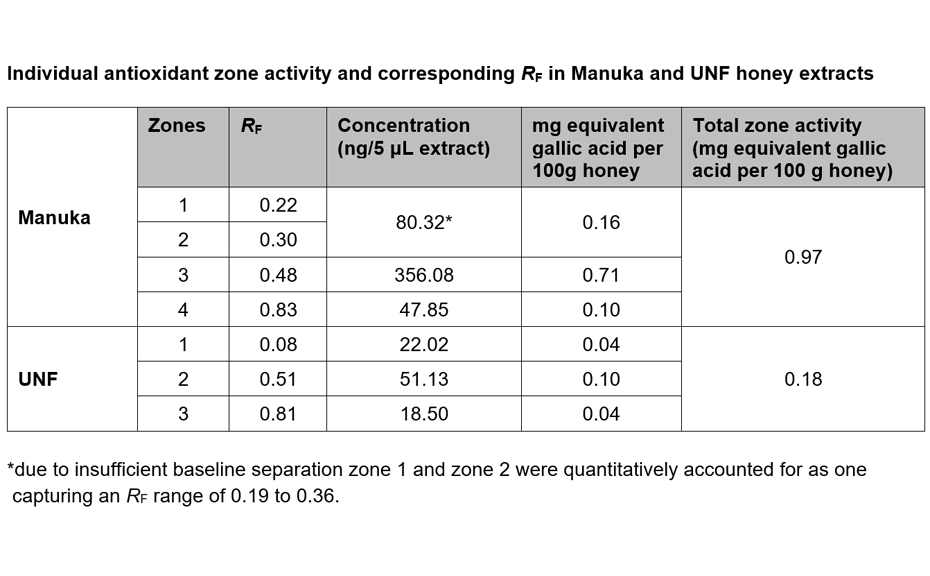
The validated HPTLC-DPPH analysis was used to visualize and quantify as gallic acid equivalents the antioxidant activity of individual zones found in Manuka and UNF honey extracts. Four antioxidant zones were detected in Manuka and three active zones in UNF honey extracts.
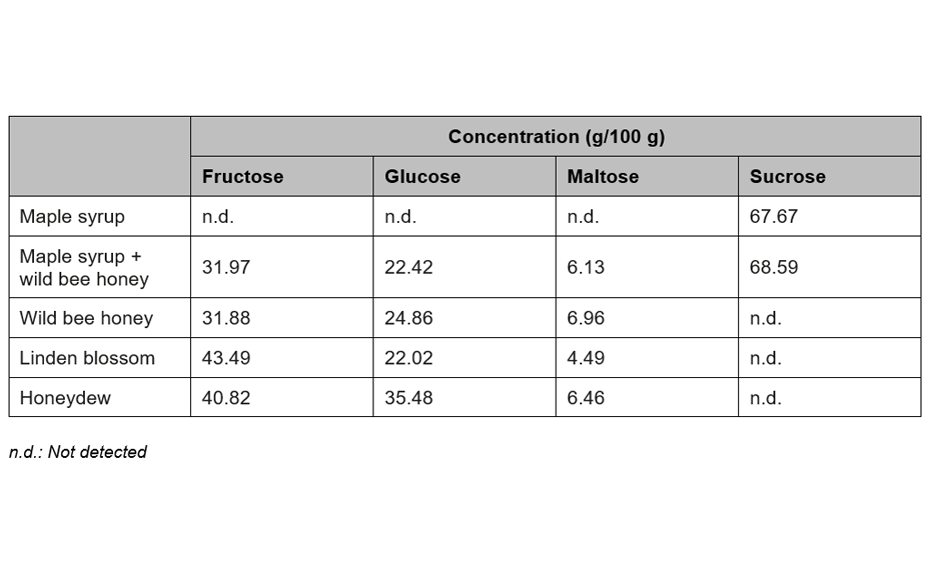
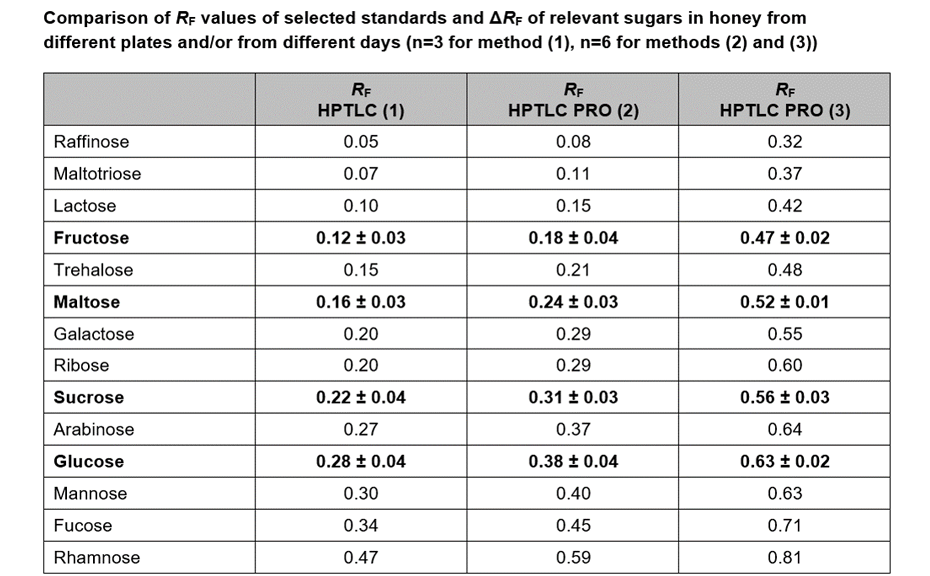
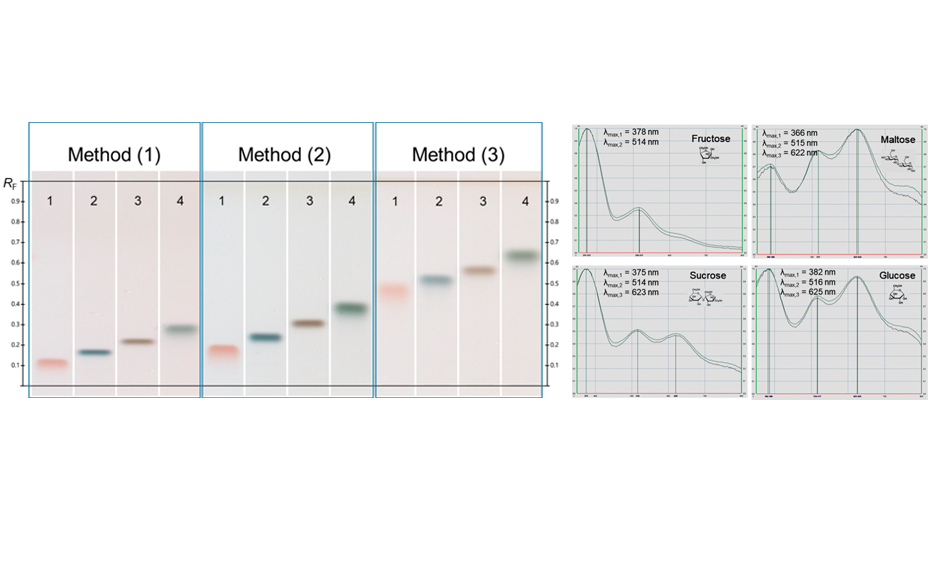
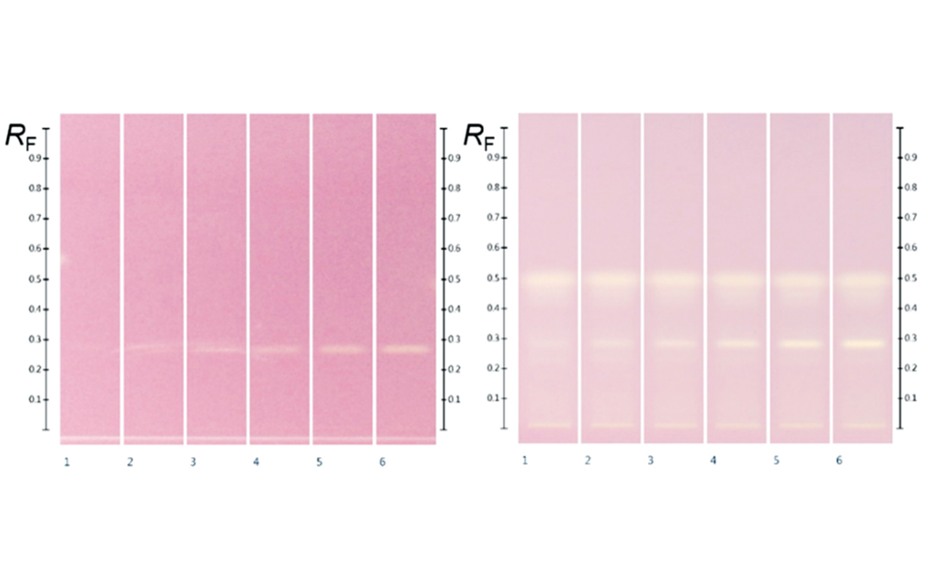
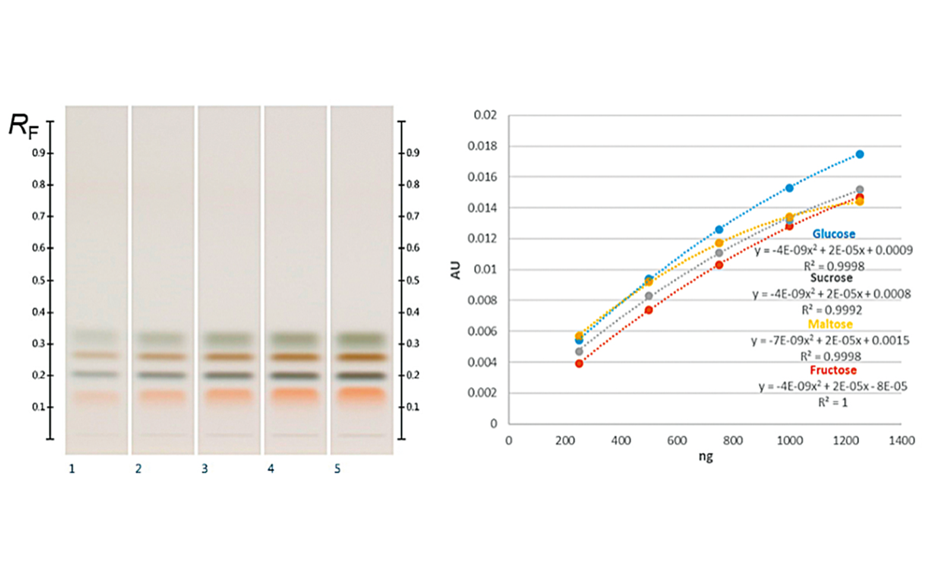
(C) At white light individual sugars presented distinct, bright colors: glucose was dark ash, fructose orange, sucrose dark brown and maltose dark green colored. Their corresponding RF values were for fructose RF 0.14, maltose RF 0.20, sucrose RF 0.27 and glucose RF 0.32 [5].
All the major sugars in honeys were clearly separated from the matrix and the sugars themselves were clearly separated from each other, forming distinct individual zones. The working range of the evaluated method was determined within the range of 250‒1250 ng/zone. The sensitivity of the method (LOD/LOQ) was calculated; LOD/LOQ for glucose: 33.0/100.0 ng; fructose: 22.0 ng/66.6 ng; sucrose: 21.2 ng/64.2 ng; maltose: 63.5 ng/192.5 ng, respectively. The accuracy, precision (intra-day and inter-day), repeatability and robustness of the developed method were also assessed and were within the acceptable ranges outlined in the International Conference on Harmonization (ICH) guidelines.
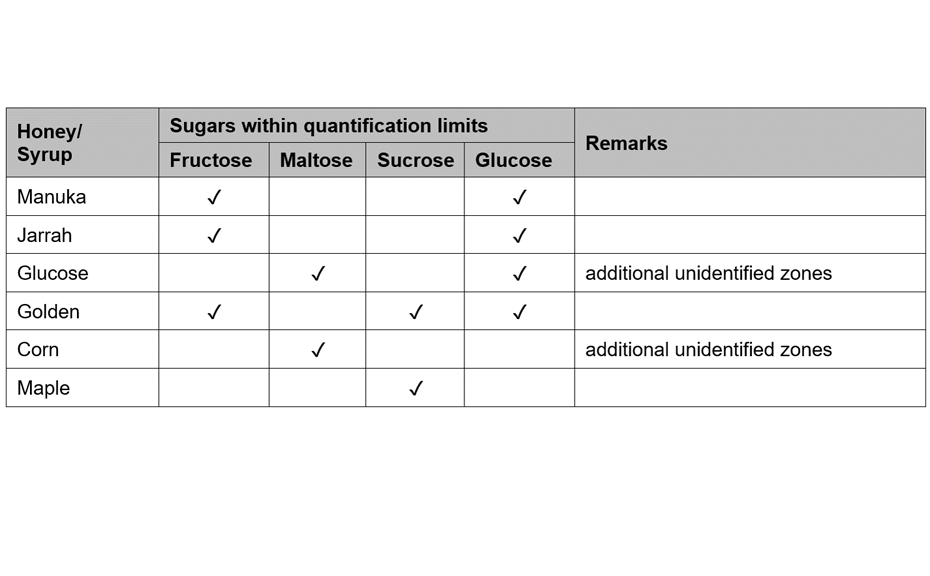
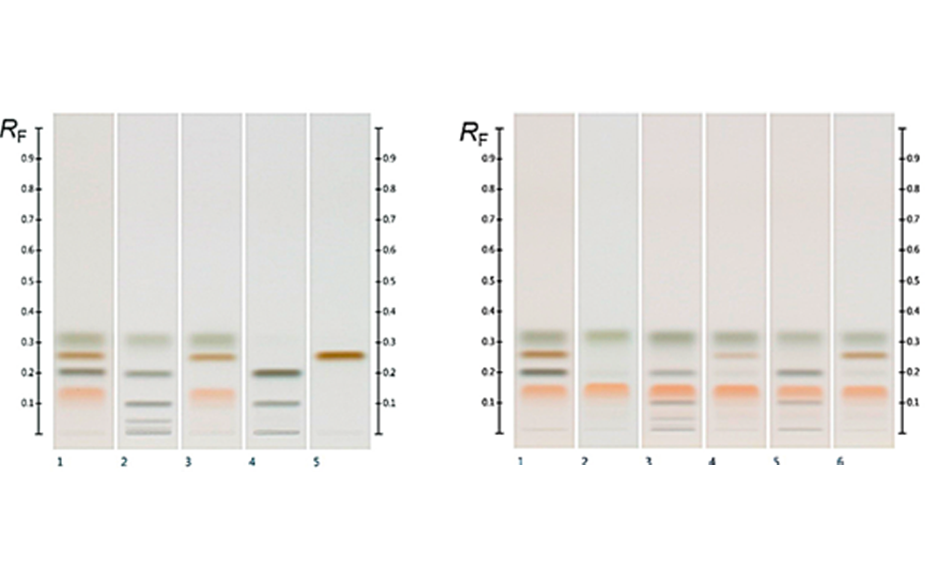
Fructose and glucose contents were readily quantifiable in all honey samples, but maltose and sucrose, if present, were below the LODs in the volumes (3.0 μL) applied (though they can be detected at higher application volumes). In all purposefully adulterated honeys, next to fructose and glucose other sugars like maltose and sucrose were easily quantifiable as they were within the working range.
Thus, mixing honey with sugar syrups leads to significant changes in the amount of sugars such as maltose and sucrose that normally are only present in minor quantities. These changes are easily detected by HPTLC analysis, as described here, and the method can, therefore, be used not only to quantify major sugars in honey but also as quality control tool to detect sugar syrup adulterations in honey.
-
-
Conclusion
(A) HPTLC fingerprint profiling of honey extracts is a quick visual screening method that can also be used for quality control to authenticate a honey’s floral origin. The predominant nectar source can be confirmed, additionally unknown or non-specific zones can be investigated for potential additional floral and non-floral compounds, which might assist in detecting adulteration cases. The method is convenient and cost-effective due to the ability to run multiple samples (up to 14) on a single plate.
(B) The study herein used honey as a model matrix to demonstrate the ability of HPTLC-DPPH analysis to visualize and quantify the antioxidant activity of individual constituents in a complex matrix even if their respective chemical identity is not (yet) known. It is anticipated that the approach can also be adopted for the analysis of other matrices with antioxidant activity like plant extracts. The method established here, provides guidance on how to examine other complex systems for potential matrix effects and to capture antioxidant activities of individual constituents.
(C) The HPTLC method for the detection and quantification of simple sugars in honey is easy to perform and offers a convenient approach to not only quantify the major sugars found in honey but also to identify potential adulteration with sugar syrups. The absence of any pre-treatment steps prior to analysis is a major advantage, which might make the method also an interesting analysis approach for the determination of simple sugars in other botanicals and foods.
-
01
Different honeys labelled as “Jarrah” (track 1), “Banksia” (track 2) and “Marri” (track 3); image at UV 366 nm (left) and white light (right) after derivatization with vanillin reagent
-
02
Different honeys labelled as “Jarrah”; image at UV 366 nm and white light after derivatization with vanillin reagent
-
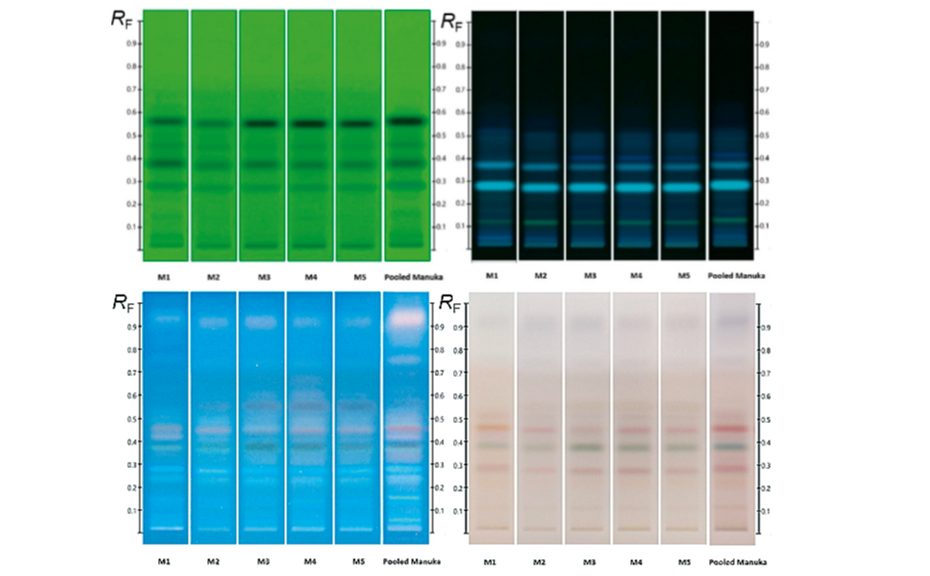
03
HPTLC fingerprints of several Manuka samples along with pooled sample; (from left to right) images at UV 254 nm, UV 366 nm after development and UV 366 nm and white light after derivatization
-
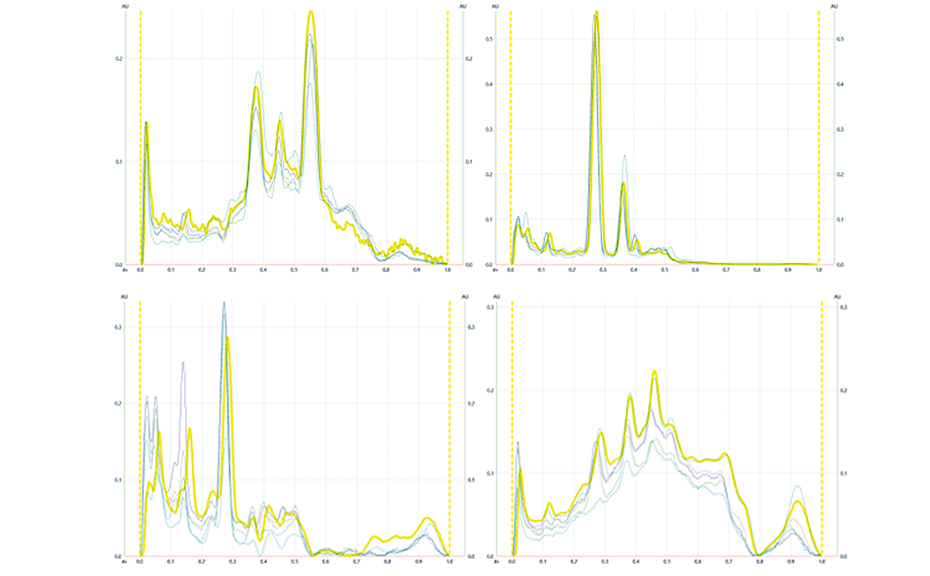
04
HPTLC peak profiles fromimages (PPI) ofManuka samples along with pooled sample highlighted in yellow at UV 254nm (1) and UV 366 nm(2) after development as well as at UV 366 nm(3) and white light (4) after derivatization with vanillin reagent
-
05
HPTLC chromatograms at white light after DPPH; (left) gallic acid (RF 0.29) 2.0, 3.0, 4.0, 5.0, 6.0, and 7.0 μL of the standard solution in methanol; (right) Manuka extracts (5 μL) overspotted with gallic acid 2.0, 3.0, 4.0, 5.0, 6.0, and 7.0 μL respectively
-
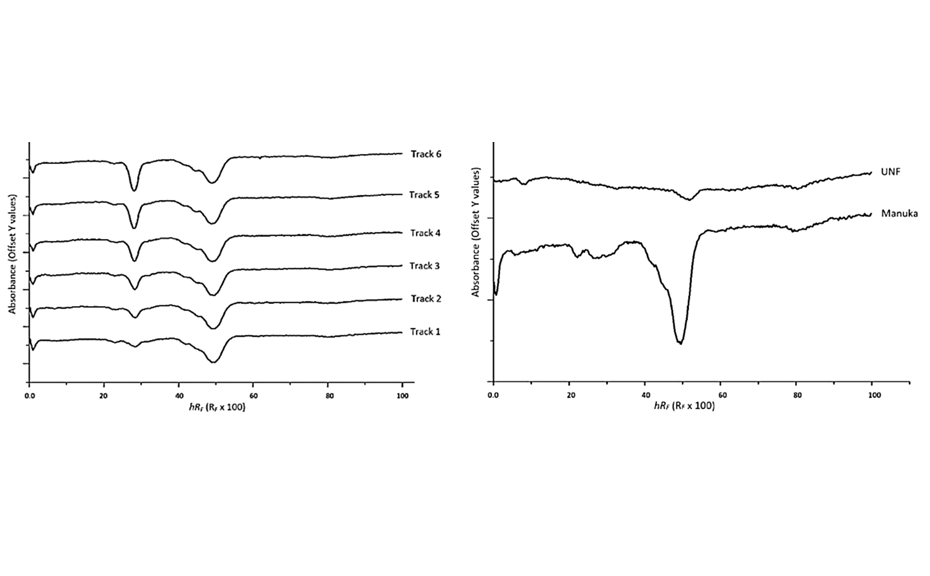
06
(left) PPI of a Manuka extract (5.0 μL) over-spotted with 2.0–7.0 μL of gallic acid (RF = 0.29 ≙ hRF = 29); (right) PPI of Manuka extract (5.0 μL) and UNF (10.0 μL)
-
07
Fructose (RF 0.14), maltose (RF 0.20), sucrose (RF 0.27) and glucose (RF 0.32) zones, and their corresponding calibration curves
-
08
(left) HPTLC chromatograms of standards (track 1) and different syrups (from track 2–5: glucose, golden, corn, and maple syrup); (right) standards (track 1), Manuka (track 2) and spiked Manuka (from tracks 3–6 with the respective syrups from the left)
Literature
[1] C. Locher et al. J Planar Chromatogr (2017) 30(1):57–62.
[2] C. Locher et al. J Planar Chromatogr (2018) 31(3):181–189.
[3] M. K. Islam et al. J Planar Chromatogr (2020) 33(3):301–311.
[4] M. K. Islam et al. J Planar Chromatogr (2020) 33(5):489–499.
[5] M. K. Islam et al. Molecules (2020) 25(22).
Further information on request from the authors.
Contact: Dr. Cornelia Locher, CRC for Honey Bee Products and Division of Pharmacy, School of Allied Health, University of Western Australia, Crawley, Western Australia, 6009, Australia, connie.locher[at]uwa.edu.au
mentioned products
The following products were used in this case study