High-throughput analysis of aroma precursors in cocoa and coffee
Dr. Vincent Lebot is a plant breeder and geneticist at CIRAD (Centre International de Coopération en Recherche Agronomique, France) and employs chromatographic separation techniques, especially instrumental planar chromatography, to select genetically improved tropical plant hybrids and varieties of suitable chemotypes. HPTLC is his preferred technique because of its low solvent consumption and running costs and its support of a high-sample throughput.
Introduction
It is estimated that there are around 24,000 varieties of cocoa and more than 30,000 varieties of coffee in the world [1, 2]. Only a few varieties have been evaluated for their quality aiming at specialty and aromatic products, which is an important trait for securing markets, especially for smallholders in small producing countries. During the fermentation and drying processes, aroma precursors present in the green beans are transformed into flavour compounds determining the quality of commercial beans. The chemical analysis of non-volatile compounds is, therefore, an essential step for the selection of varieties with desired quality traits. Alkaloids (theobromine and caffeine) and polyphenols (catechins, proanthocyanidins and anthocyanins) are contributing to the cocoa flavour. Caffeine, trigonelline and chlorogenic acids are known to produce astringent and sour taste and bitterness in coffee but very few varieties have been compared in controlled conditions. Sucrose is also an aroma precursor in coffee and depends on the variety. The objectives of this study were: i) to develop a protocol for the quantification of non-volatile compounds in cocoa and coffee, ii) to analyze and compare cocoa and coffee varieties from diverse geographical origins cultivated in controlled conditions and harvested at full maturity.
Standard solutions
Standard stock solutions of theobromine, trigonelline, caffeine, ideain-3-O-galactoside, cyanidin- 3-O-arabinoside, (–)-epicatechin, (–)-catechin, chlorogenic acid (CGA), neochlorogenic acid (NCGA or 5-O-caffeoylquinic acid), 3,4-, 3,5-, 4,5- dicaffeoylquinic acids, and sucrose are prepared at 1.0 mg/mL with methanol. Standard solutions are prepared at different concentration levels with methanol and stored at 4 °C.
Sample preparation
Cocoa pods and coffee berries are handpicked and selectively harvested when they are completely mature to guarantee the complete uniformity of the material from the different accessions. All samples are collected from a single healthy tree per accession basis. Green beans of cocoa and coffee were then oven dried at 60 °C until constant weight (11% humidity) and milled. For each accession sample, 10 g of powder are mixed in centrifuge tubes with 30.0 mL of acetone for cocoa and 30.0 mL of methanol – water 7:3 (v/v) for coffee, sonicated for 10 min and then centrifuged at 1,585 x g for 10 min. The supernatant is transferred to a vial stored at 4 °C in the dark until analysis.
Chromatogram layer
HPTLC plates silica gel 60 F254 (Merck) 20 x 10 cm are used.
Sample application
1.0 μL of standard and sample solutions are applied as bands with the Automatic TLC Sampler (ATS 4), band length 8.0 mm, distance from the left edge 15.0 mm, track distance 8.9 mm.
Chromatography
Plates are developed in the Automatic Developing Chamber (ADC 2) with ethyl acetate – toluene – formic acid – water 7:1:1:1 (v/v) without chamber saturation for cocoa extracts and with ethyl acetate – dichloromethane – formic acid – acetic acid – water 23:6:2:2:2 (v/v) with chamber saturation (10 min, with filter paper) for coffee extracts, to a migration distance of 70.0 mm. For sucrose, plates are developed with acetonitrile – water 87:13 (v/v) without chamber saturation to a migration distance of 85 mm.
Documentation
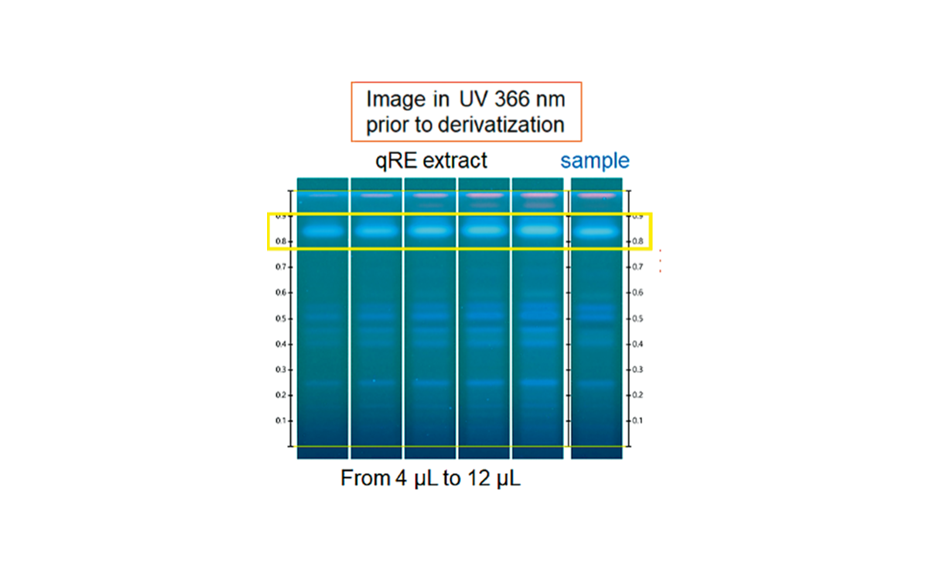
Images of the plates are captured with the TLC Visualizer in UV 254 nm and UV 366 nm and in white light after derivatization.
Densitometry
Absorbance measurement at 275 nm and 330 nm prior to derivatization and for sucrose at 520 nm after derivatization with TLC Scanner 4 and winCATS, slit dimension 8.00 mm x 0.20 mm, scanning speed 50 mm/s.
Editor’s Note: A slit length of 5.00 mm is usually used for a band length of 8.00 mm.
Derivatization
The plate is immersed into anisaldehyde reagent (for proanthocyanidins) or aniline-diphenylaminephosphoric acid reagent (for sucrose) with the Chromatogram Immersion Device and heated on the TLC Plate Heater at 105 °C for 10 min.
Results and discussion
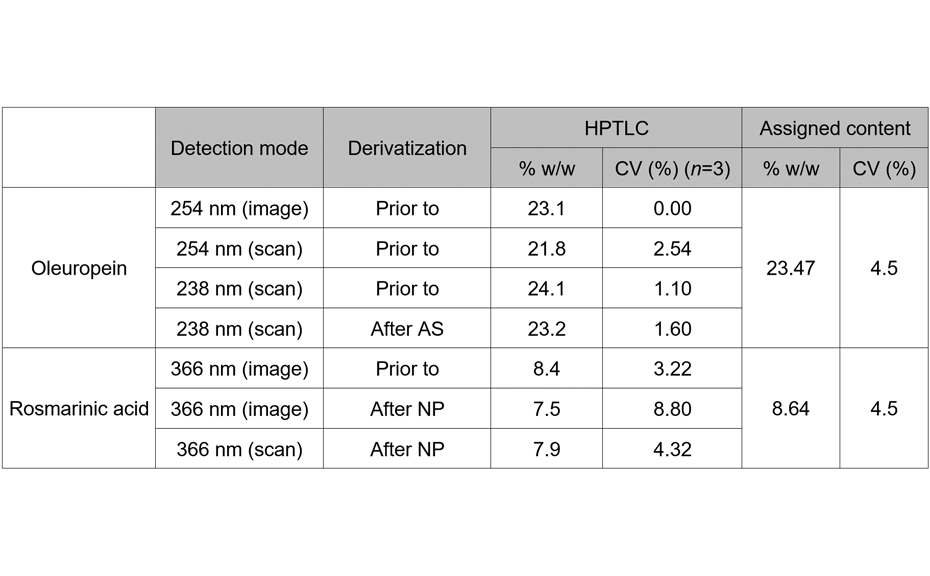
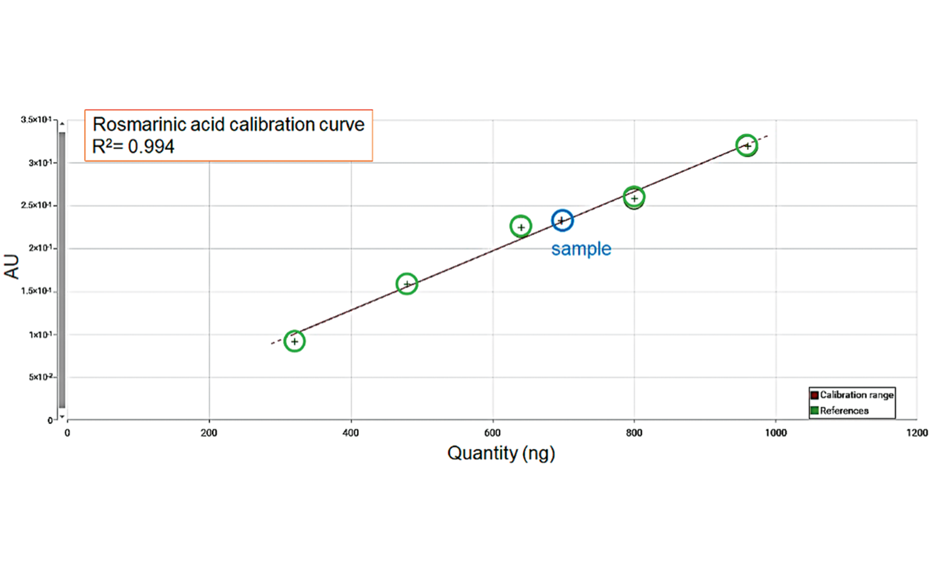
For repeatability accuracy assessment, linear ranges were computed using the least squares method. Repeatability was confirmed by applying four repetitions of each standard at five different concentration levels (0.1, 0.2, 0.3, 0.4, 0.5 μg/μL) and the variance among repetitions was expressed as the repeatability standard deviation (%RSD) [3]. Peak area measurements were compared to individual standards and corresponding values were quantified in mg/g dry weight [3]. The repeatability of the HPTLC measurements was assessed for each individual standard and the calibration plots were linear for all analytical standards with all R2 > 0.99 (P = 0.01). For each compound, %RSD values were low (< 3.5%) indicating that the HPTLC measurements are accurate enough to be used for quantification.
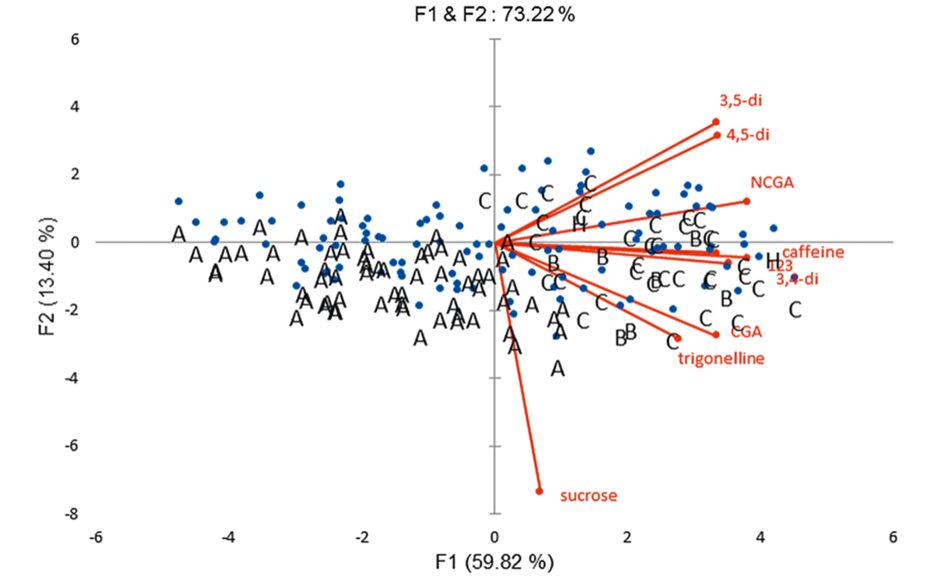
Multivariate analysis of non-volatile compounds (via peak areas obtained by scanning densitometry) in 137 cocoa varieties clearly discriminates the different groups of varieties (Amenolado, Criollo, Forastero, Trinitario). Theobromine was the most important compound in all accessions analyzed, followed by caffeine, epicatechin/catechin, cyanidin, and ideain. Proanthocyanidin B2 was also important and four other proanthocyanidins were minor compounds [3]. The 108 varieties of coffee analyzed were clearly differentiated based on their caffeine content which is significantly correlated with chlorogenic acids. Arabica varieties present low caffeine. Sucrose, trigonelline, caffeine, and eight chlorogenic acids were detected and quantified based on the RF values of the standards and by matching their UV spectra with those of the samples [3]. Principal component analysis (PCA) of the coffee varieties shows that 73.2% of the total variation is explained by axis 1 and 2. C. arabica are characterized by low alkaloids and CGAs contents and are mostly located on the left side of axis 1, while C. canephora characterized with high alkaloids and CGAs contents are located on the right side of axis 1.C. arabica with < 11 mg/g of caffeine are on the far left end of axis 2 and C. canephora with > 18 mg/g of caffeine are on the far right end of axis 2. Further results and details are available at [3].
-
01
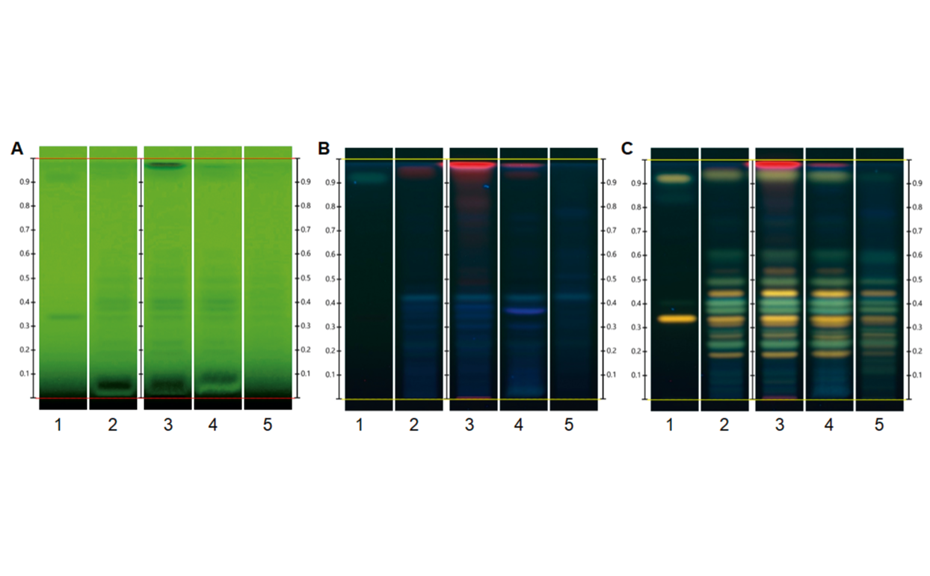
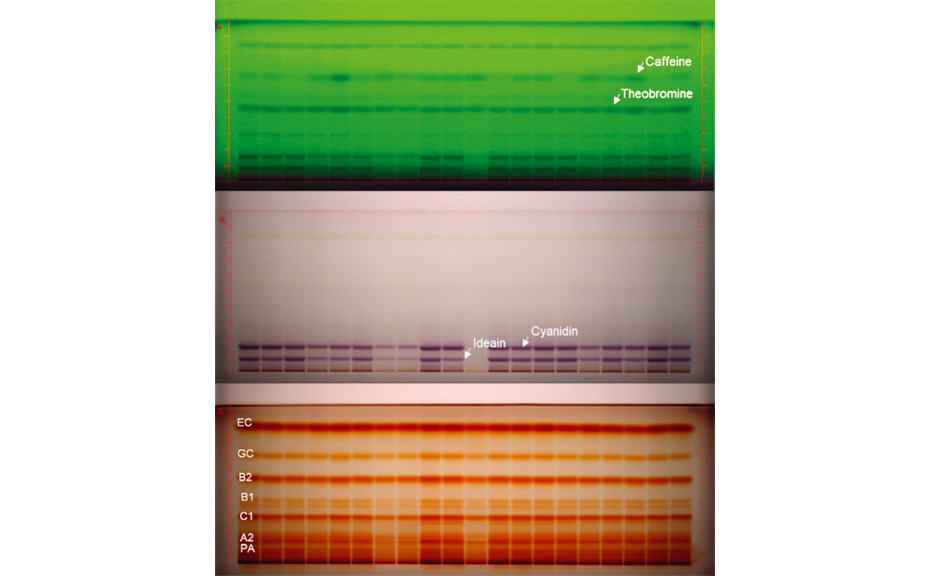
HPTLC chromatograms of different cocoa varieties (20 tracks, top: UV 254 nm prior to derivatization, middle: white light prior to derivatization, bottom: white light after derivatization with anisaldehyde reagent for polyphenols: (–)-epicatechin: EC and (–)-catechin: GC, and proanthocyanidins: PA, A2, C1, B1, B2 [3]
-
02
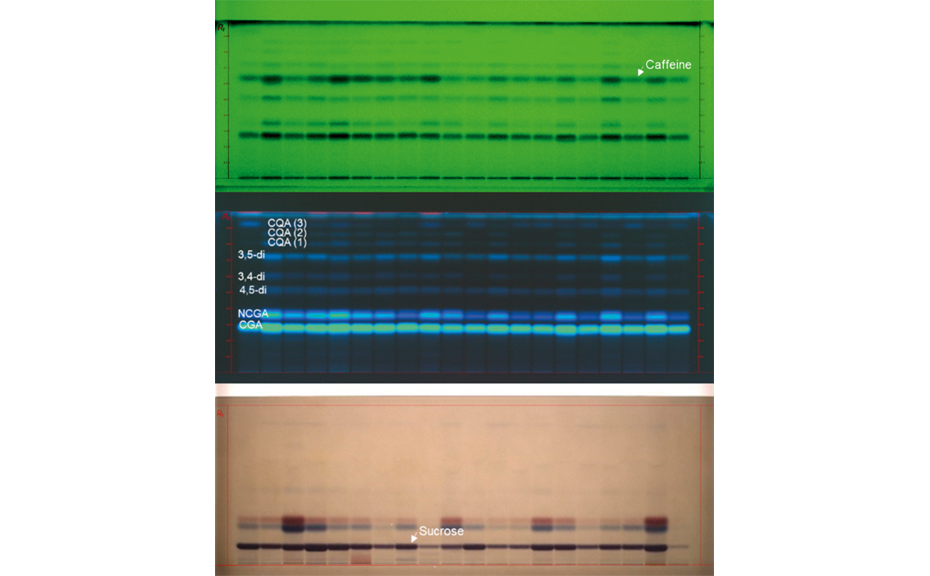
HPTLC chromatograms of different Arabica coffee varieties (20 tracks, top: UV 254 nm prior to derivatization, middle: UV 366 nm prior to derivatization, bottom: white light after derivatization with ADPA reagent.
-
03
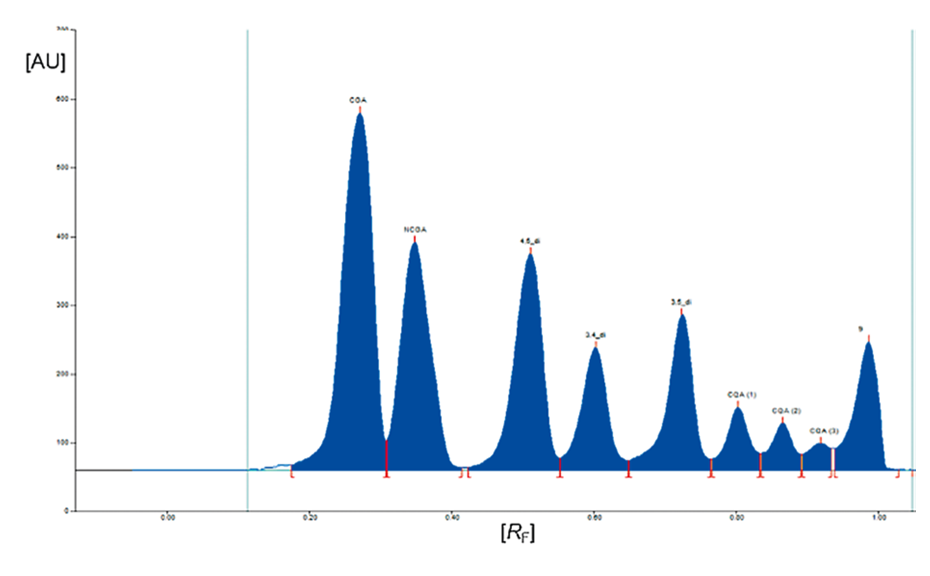
Densitogram of a coffee sample measured at 330 nm prior to derivatization (with increasing RF values chlorogenic acid (CGA), neo-chlorogenic acid (NCGA or 5-O-caffeoylquinic acid), 4,5-dicaffeoylquinic acid (4,5-di), 3,4-dicaffeoylquinic acid (3,4-di), 3,5-dicaffeoylquinic acid (3,5-di), and three unknown caffeoylquinic acids labelled as CQA (1), CQA (2), CQA (3).
-

04
Overlay of UV spectra of CGA standard and samples (recorded from 200–550 nm) to determine the optimum wavelength for scanning densitometry (λmax at 330 nm)
-
05
PCA of 108 accessions of Coffee arabica (A), C. arabusta (B), C. canephora (C), and hybrids of C. canephora and C. congensis (H). The Arabica varieties (A) are differentiated from Canephora (robusta) varieties by their low chlorogenic acids contents (left of axis 1).
Conclusion
HPTLC is a cost-efficient technique when applied to both qualitative and quantitative assessment of chemical constituents in green cocoa and coffee beans. Compared to other chromatographic techniques, HPTLC presents the outcome as an image of the separated non-volatile compounds on a single plate, detected by UV light. This visible outcome and the simplicity of the technique could allow breeders to run the chromatographic procedure described in this study on hundreds or thousands of varieties and breeding lines. The analysis time for a plate with 20 tracks is comparatively short (approximately 38–42 minutes) and diverse genotypes can be analyzed side by side on the plate, making HPTLC the method of choice for rapid chemometric evaluation of cocoa and coffee varieties and detection of exceptional individuals.
Literature
[1] Laliberté, B. et al. (2012) https://agritrop.cirad.fr/568442/1/document_568442.pdf
[2] Bramel, P. et al. (2017) https://worldcoffeeresearch.org/media/documents/Coffee_ Strategy_Low_Res.pdf
[3] Lebot, V. et al. Gen Res Crop Evol (2020) 67: 895–911
Contact: Dr. Vincent Lebot, UMR AGAP, CIRAD, P.O. Box 946, Port-Vila, Republic of Vanuatu, lebot[at]vanuatu.com.vu