Application of Design of Experiments (DoE) on robustness studies and method evaluation of an HPTLC method for Arnica flower
The bachelor thesis described below was conducted at the Department of Analytical Research / Development at WALA Heilmittel GmbH in cooperation with Esslingen University of Applied Sciences, Germany.
Dr.-Ing. Margit Müller leads the team of Analytical Development Intermediate and Finished Products at WALA Heilmittel GmbH (Bad Boll, Germany). She and her team are responsible for analytical methods and specifications for medicinal products and plant-based active pharmaceutical ingredients including herbal drugs. HPTLC and TLC methods are widely used for identity testing in quality control, including stability testing of WALA products.
Prof. Dr. Constanze Stiefel teaches instrumental analysis at the Faculty of Science, Energy and Building Services at Esslingen University of Applied Sciences. Her research focuses on the application and development of chromatographic methods, including HPTLC and effect-directed analysis to determine bioactive compounds, contaminants and residuals in food and cosmetics.
Alina Kaya studied Chemical Engineering / Color and Coatings at Esslingen University of Applied Sciences. The shown study represents her bachelor thesis, concluding her Bachelor of Science degree.
Introduction
The presented study examines the implementation of software-based Design of Experiments (DoE) for robustness studies and method evaluation using the European Pharmacopoeia HPTLC method for identity testing of Arnica flower (monograph 1391, Ph. Eur. 11.0) as an example. DoE is expected to reduce practical effort in comparison to the traditional “one-factor-at-a-time” approach of experimentation. A statistically-based DoE approach aims at identifying significant factors and their interactions in relation to one or more response variables. Furthermore, it can be used to assess the robustness of the method against various factors or factor ranges.
The practical implementation of robustness studies is time-consuming. The use of DoE is intended to make these investigations more efficient by reducing practical effort while at the same time broadening method knowledge. Once a robust and valid parameter range has been identified by DoE, future method changes can be assessed with more confidence. The regulatory relevance of such variations can thus be reduced, which is advantageous because the testing of medicinal products must adhere either precisely to European Pharmacopoeia methods or require validation for every modified method. The use of DoE enables significant time and cost savings, making it highly interesting for pharmaceutical manufacturers.
Design of Experiments
The set-up of DoE-based experimental plans was carried out with the help of the software “Design Expert®” (version 22, StatEase, USA). Screening, characterization, and optimization studies were carried out.
A two-level factorial design was used for screening and characterization studies, investigating linear relations. Response surface methods were used for carrying out optimization studies, investigating more complex relationships such as quadratic relations. To take a closer look at the influence of the developing solvent components, a Mixture Design was used.
Standard solutions
Reference solution a: 1.0 mL of caffeic acid solution (1.0 mg/mL) and 1.25 mL of rutoside rihydrate solution (1.0 mg/mL) are diluted in methanol R to 5.0 mL.
Reference solution b: 500 µL of caffeic acid solution (1.0 mg/mL) and 625 µL of rutoside-trihydrate solution (1.0 mg/mL) are diluted in methanol R to 10.0 mL.
Reference solution c: 1.0 mL of chlorogenic acid solution (1.0 mg/mL) and 2.5 mL of hyperoside solution (1.0 mg/mL) are diluted in methanol R to 10.0 mL (used as system suitability test (SST)).
Sample preparation
2.00 g of powdered herbal drug (710) are extracted with 10.0 mL of methanol R, ultrasonically treated for 15 min, and filtered. The filtrate is used.
Chromatogram layer
HPTLC glass plates silica gel 60 F254 (Merck), 20 × 10 cm (cut into 10 × 10 cm) resp. 10 × 10 cm plates are used.
Sample application
2.0 µL of sample and reference solutions are applied as bands with Automatic TLC Sampler (ATS 4), band length 8.0 mm, distance from left edge 20.0 mm, track distance 12.0 mm, distance from the lower edge 8.0 mm.
Chromatography
Plates are developed up to 70 mm (from the lower edge) in a saturated 10 × 10 cm twin trough chamber with formic acid R – water R – ethyl acetate R 6:9:90 (V/V), followed by drying for 5 min with a cold air dryer.
Post-chromatographic derivatization
Plates are derivatized using the Derivatizer. After heating the plate at 105 °C for 5 min, the plate is sprayed while still warm, with 2.0 mL of diphenylboryloxyethylamine in methanol R (10 g/L) and 2.0 mL of Macrogol 400 R in methanol R (50 g/L), blue nozzle, praying level 3. The plate is air dried for 5 min.
Documentation
Images of the plate are captured with the TLC Visualizer in UV 366 nm after derivatization.
Results and discussion
In the first step of the investigation, critical risk factors were identified through a two-level factorial screening DOE design. As a result of the risk analysis, nine factors were identified as potentially critical for this HPTLC method. High level (+ 1) and low level (− 1) values of each risk factor were defined. The resolution between the two SST-components was selected as the response.
Before starting the experiments, a statistical power analysis was carried out using the software to ensure that the experimental plan had good predictive power. The power of a system should always be above 80%, which was confirmed in this case. Experimental runs were performed in the laboratory, and response values were measured.The measured responses were entered into the Design Expert software against respective experimental runs and data analysis was performed using half normal plots and Pareto charts.
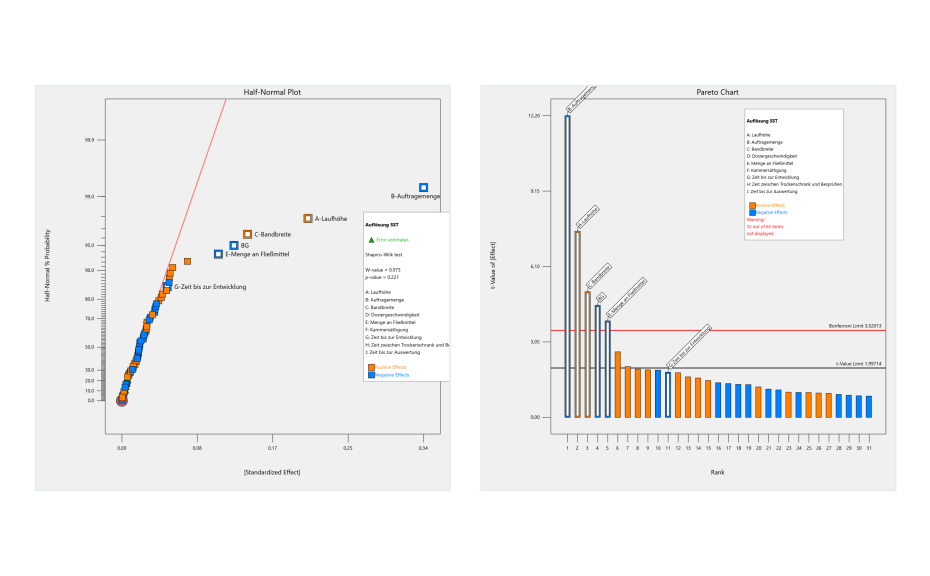
Half normal plot (left) and pareto chart (right) of two-level factorial screening design. Factors deviating from the red line of the half normal plot or the bars above the red line of the Pareto chart are statistically significant.
From the screening design, it was concluded that the application rate, development distance, volume of developing solvent, band length and the two-factor interaction between application rate and time until development are statistically significant. These identified risk factors need to be optimized to minimize their risk. Optimization was performed by DoE based on a central composite design. The central composite design was selected as response surface methodology to establish the relationship between the identified critical risk factors and resolution of the SST. Resolution values were added into the software against their respective experimental runs, and response surface analysis was performed with the help of variance analysis (ANOVA) and contour plots.
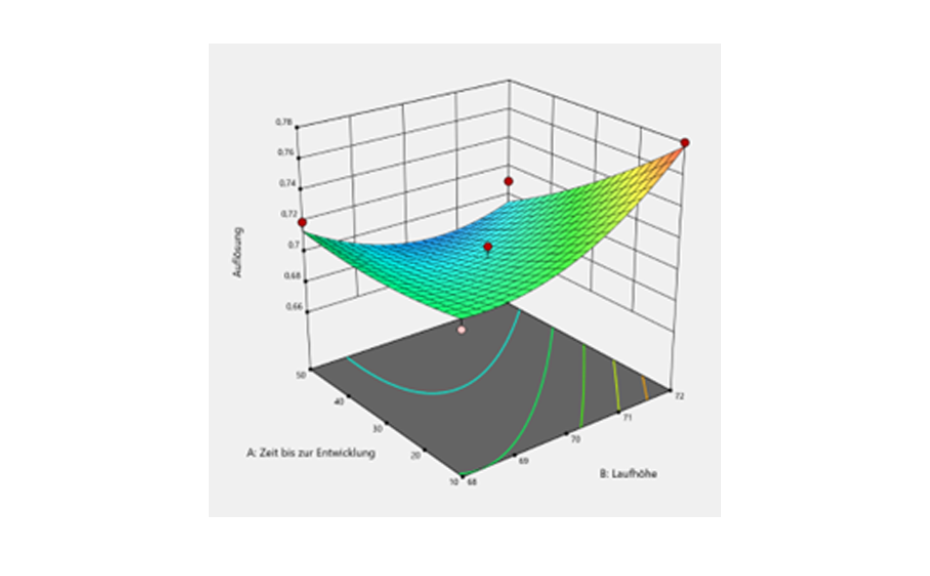
3D-contour plot of the experimental space
Although the optimization of significant factors was not successful in the context of this HPTLC-method, as no meaningful results could be generated, it can be said that the method is robust in the examined area because the resolution values of the different experiments changed only slightly.
For additional insights, an optimal mixture design study was carried out by investigating the robustness of the method with respect to formic acid and ethyl acetate concentration in the developing solvent. In addition to resolution of the SST components, the position of chlorogenic acid (substance of the SST) in the densitogram (expressed in mm) was selected as response parameter. With increasing amounts of ethyl acetate and decreasing amounts of formic acid, the resolution and the absolute position of chlorogenic acid decreased.
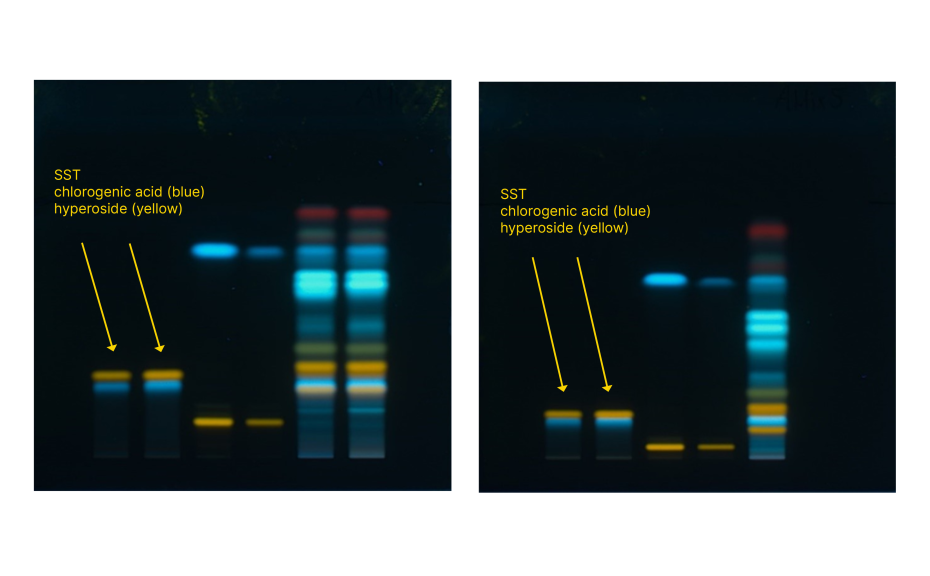
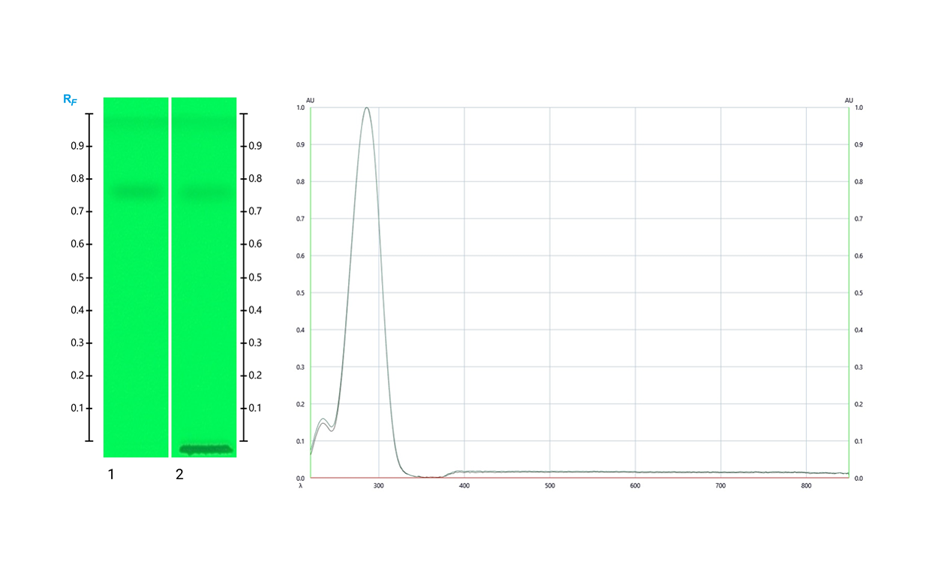
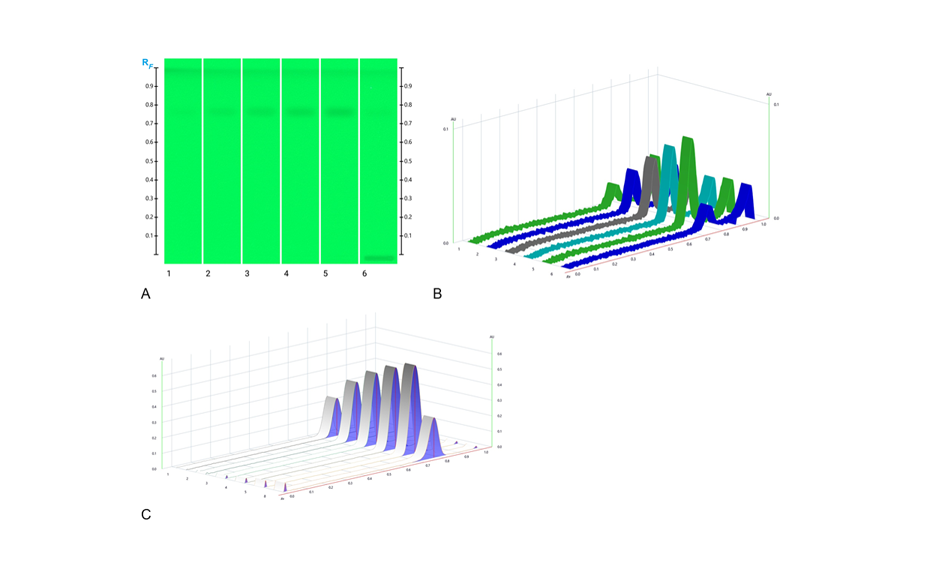
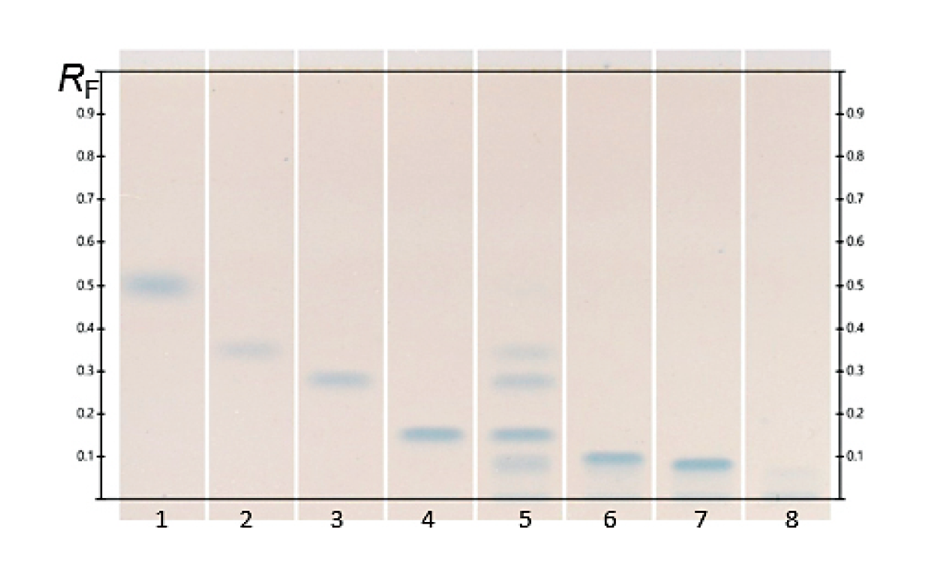
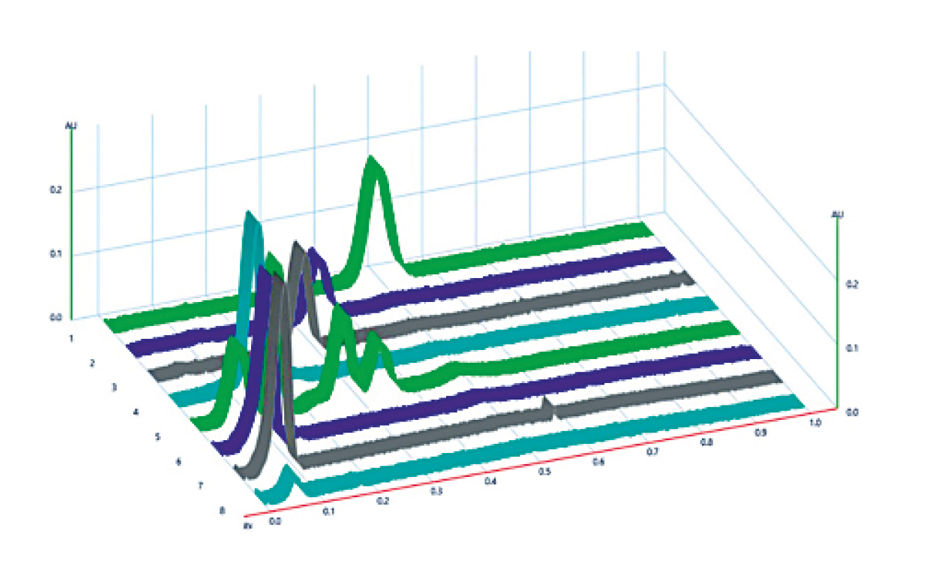
Comparison of SST resolution with the highest proportion of formic acid (left) and the lowest proportion of formic acid (right)
The application of DoE enables the efficient solution of different chromatographic problems in the field of TLC and HPTLC, in robustness studies of various method parameters, and in method validations, by creating systematic, precise experimental plans. The influence of various factors on any number of target variables can be investigated and evaluated in an experimental design. However, it must be noted that the number of tests increases with the number of factors to be investigated. The study showed that it was straightforward to assess the robustness of the selected TLC method across various factors. It was also possible to estimate the impact of method changes on the target variable within the area investigated by DoE.
Optimizing significant factors and minimizing their risks by determining a robust range was not possible for the presented method. However, this limitation may not apply to other methods. Various software programs offer a wide range of experimental design options. These include screening designs, response surface designs, mixture designs and many more. The generated data can be analyzed using a variety of statistical methods and analysis tools.
The results can be visualized through diagrams, graphs, and three-dimensional models. The results are statistically validated by the implementation of DoE-based experimental plans. However, it is essential to carefully consider the design of the experiment and the choice of factors and responses. The experimental conditions should be carefully controlled, and it should be ensured that the results are statistically valid and relevant to the intended field of application.
As a result, the thesis proved that by using a DoE-based approach the relevance of various robustness parameters and changes regarding developing solvent components can be assessed systematically and efficiently relating to the selected response parameter resolution of SST-components.
Literature
[1] Anderson, M. J. and Whitcomb, P. J. DOE simplified. Practical tools for effective experimentation. CRC Press. (2015)
[2] Anderson, M. J. RSM Simplified. Optimizing processes using response surface methods for design of experiments, second edition. CRC Press. (2017)
[3] Spangenberg, B. Quantitative Dünnschichtchromatographie. Eine Anleitung für Praktiker. Springer Spektrum (2014)
Contact:
Dr.-Ing. Margit Müller, WALA Heilmittel GmbH, Badwasen 2(T1), 73087 Bad Boll, Germany, margit.mueller[at]wala.de
Prof. Dr. Constanze Stiefel, Hochschule Esslingen, Kanalstraße 33, 73728 Esslingen, Germany, constanze.stiefel[at]hs-esslingen.de
Alina Kaya, alinameryemkaya[at]gmail.com


![HPTLC fingerprints of InsPx (10 U*L-1, 37 °C) of the phytase Quantum® Blue at pH 3.6 (tracks 1–8) and pH 5.5 (tracks 11–18) at the time points 5, 30, 60, 120, 180, 240, 300 min and 24 h in ascending order; Image from [1] (https://creativecommons.org/licenses/by/4.0/legalcode).](/wp-content/uploads/2024/07/CBS131_Inositol_phosphate_analysis_by_HPTLC_img3.png)