Simultaneous determination of flavonoids and anthraquinones in seven Cassia species
Simultaneous determination of flavonoids and anthraquinones in seven Cassia species
Introduction
Cassia is a genus of the Fabaceae family, widely distributed in tropical and subtropical regions across the globe, with approximately 500 species reported [1]. It has a wide array of pharmacological applications, including purgation and laxatives [2]. Various parts of these species have been explored to date; however, some species have not been fully explored for their phytochemical attributes. Hence, the developed HPTLC method was applied for the chromatographic identification of flavonoids and anthraquinones in leaves and flowers, covering thirteen compounds with excellent separation. This method could further be applied for bioprospection to the other Cassia species and related botanicals [3].
HPTLC is one of the easiest ways to qualitatively and quantitatively determine phytochemicals present in various plant parts, raw materials, extracts, dietary supplements, nutraceuticals, and adulterants. It is a reliable, rapid, green, and low-cost technology used across numerous disciplines. Researchers have shown remarkable interest in HPTLC-based analysis over the past few decades.
Recent advancements in HPTLC instrumentation by CAMAG include the introduction of an automated derivatizer for uniform spraying of derivatizing reagents and a mass spectroscopy (MS) interface, which aligns with the MS system for molecular mass confirmation. In the present investigation, we report a simple, specific, and reliable separation method for the phytochemical fingerprinting of leaves and flowers of seven different Cassia species from India.
Standard solutions
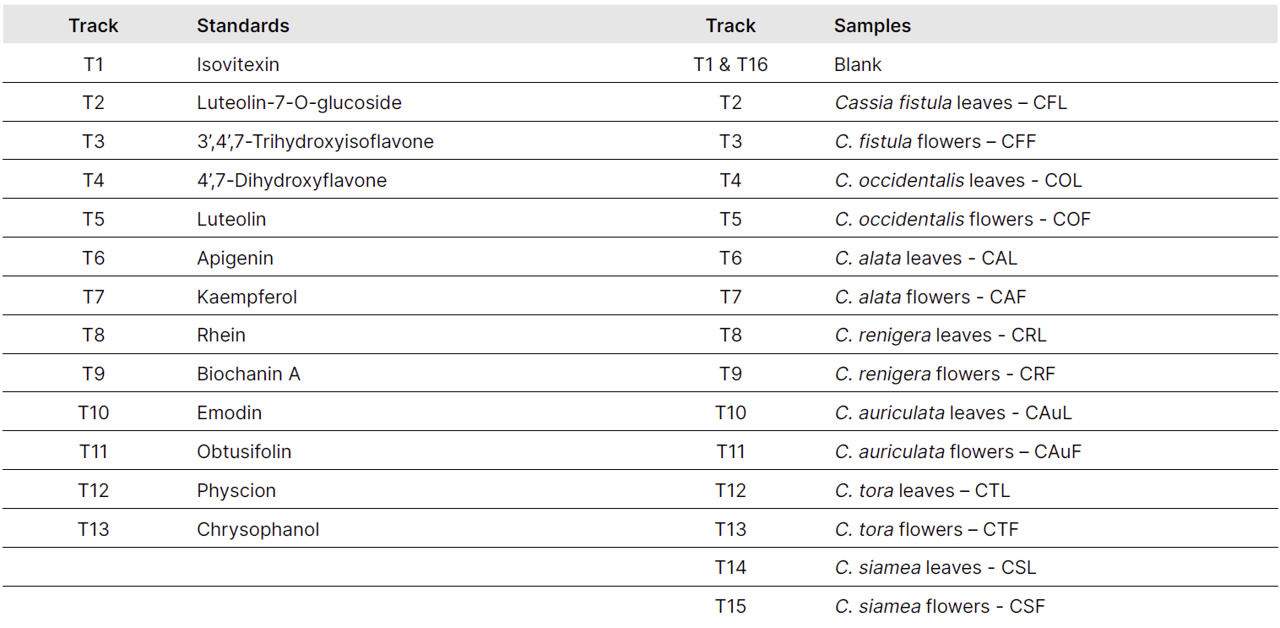
The stock solution for each reference standard was separately prepared at a concentration of 1.0 mg/mL for isovitexin (1), and 0.5 mg/mL for the other standards: luteolin-7-O-glucoside (2), 3’,4’,7-trihydroxy isoflavone (3), 4’,7-dihydroxyflavone (4), luteolin (5), apigenin (6), kaempferol (7), rhein (8), biochanin A (9), emodin (10), obtusifolin (11), physcion (12), and chrysophanol (13).
Sample preparation
Two different plant parts from seven different Cassia species were extracted with methanol at a concentration of 50 mg/mL. Before concentrating, the lipid portion of the filtrate was removed using n-hexane. The resulting extract was used for further analysis.
Chromatogram layer
HPTLC plates silica gel 60 F254 (Merck) are used.
Sample application
2.0 µL of sample and standard solutions are applied as bands with the Automatic TLC Sampler (ATS 4), 13 tracks for standards, 15 tracks for samples, band length 8.0 mm, distance from the left edge 20.0 mm, track distance 11.4 mm, distance from the lower edge 8.0 mm.
Chromatography
Plates are developed in the ADC 2 with chamber saturation (with filter paper) for 20 min, and after activation at 33 % relative humidity for 10 min using a saturated solution of magnesium chloride, development with toluene – ethyl acetate – formic acid 55:42:6 (V/V) to the migration distance of 70 mm (from the lower edge), followed by drying for 5 min.
Post-chromatographic derivatization
The plate was immersed into NP-PEG reagent using the Chromatogram Immersion Device, immersion speed 3 cm/s and immersion time 6 s, dried for 30 s with cold air, and heated at 140°C for 30 min using the TLC Plate Heater.
Documentation
Images of the plate are captured with the TLC Visualizer in UV 366 nm.
Results and discussion
An accurate analysis plays acrucial role in natural product research and in fields involving complex mixtures. The selection of rapid and precise analytical techniques, such as HPTLC, has become increasingly popular and is now widely accepted by various food agencies and regulatory bodies. The HPTLC-based analysis provides authentic, precise, and reliable data, using a green methodology, saving both time and manpower.
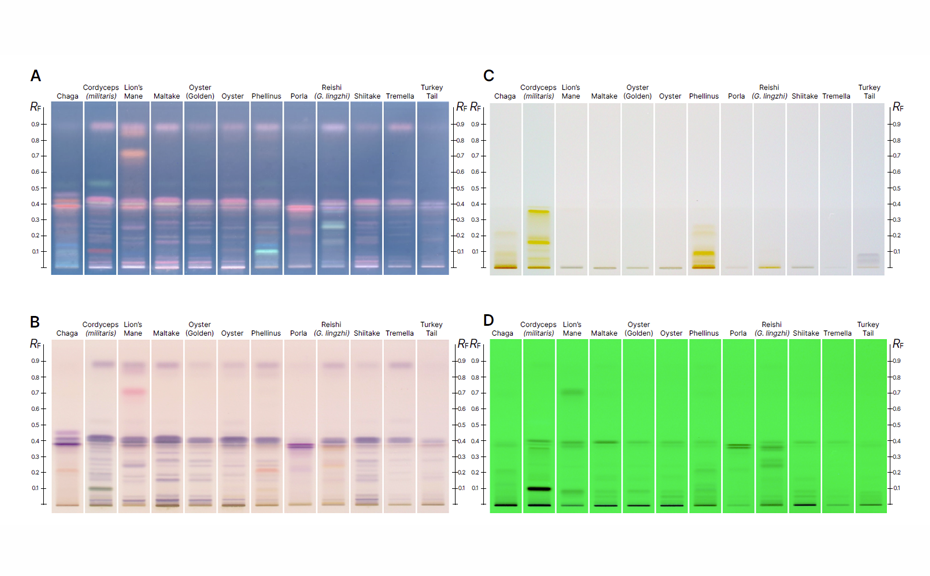
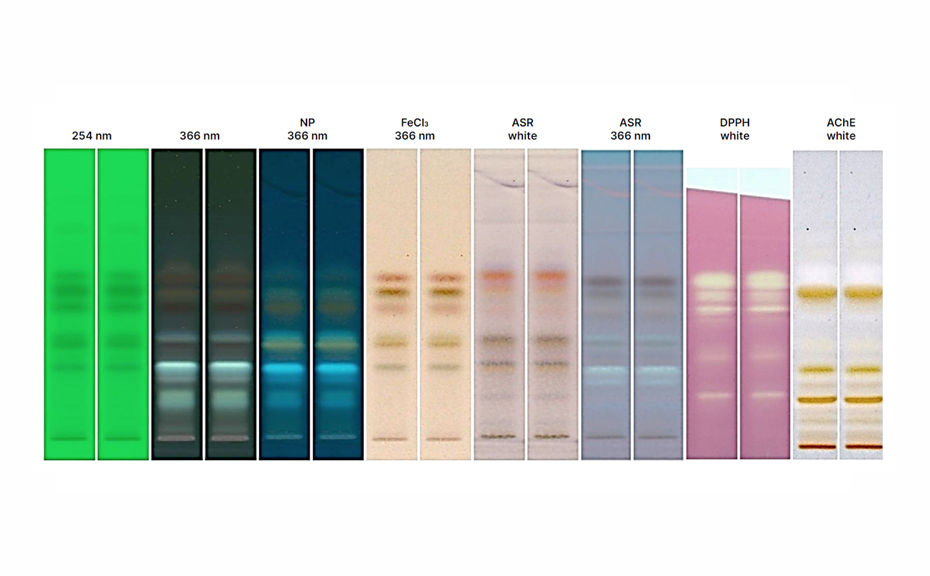
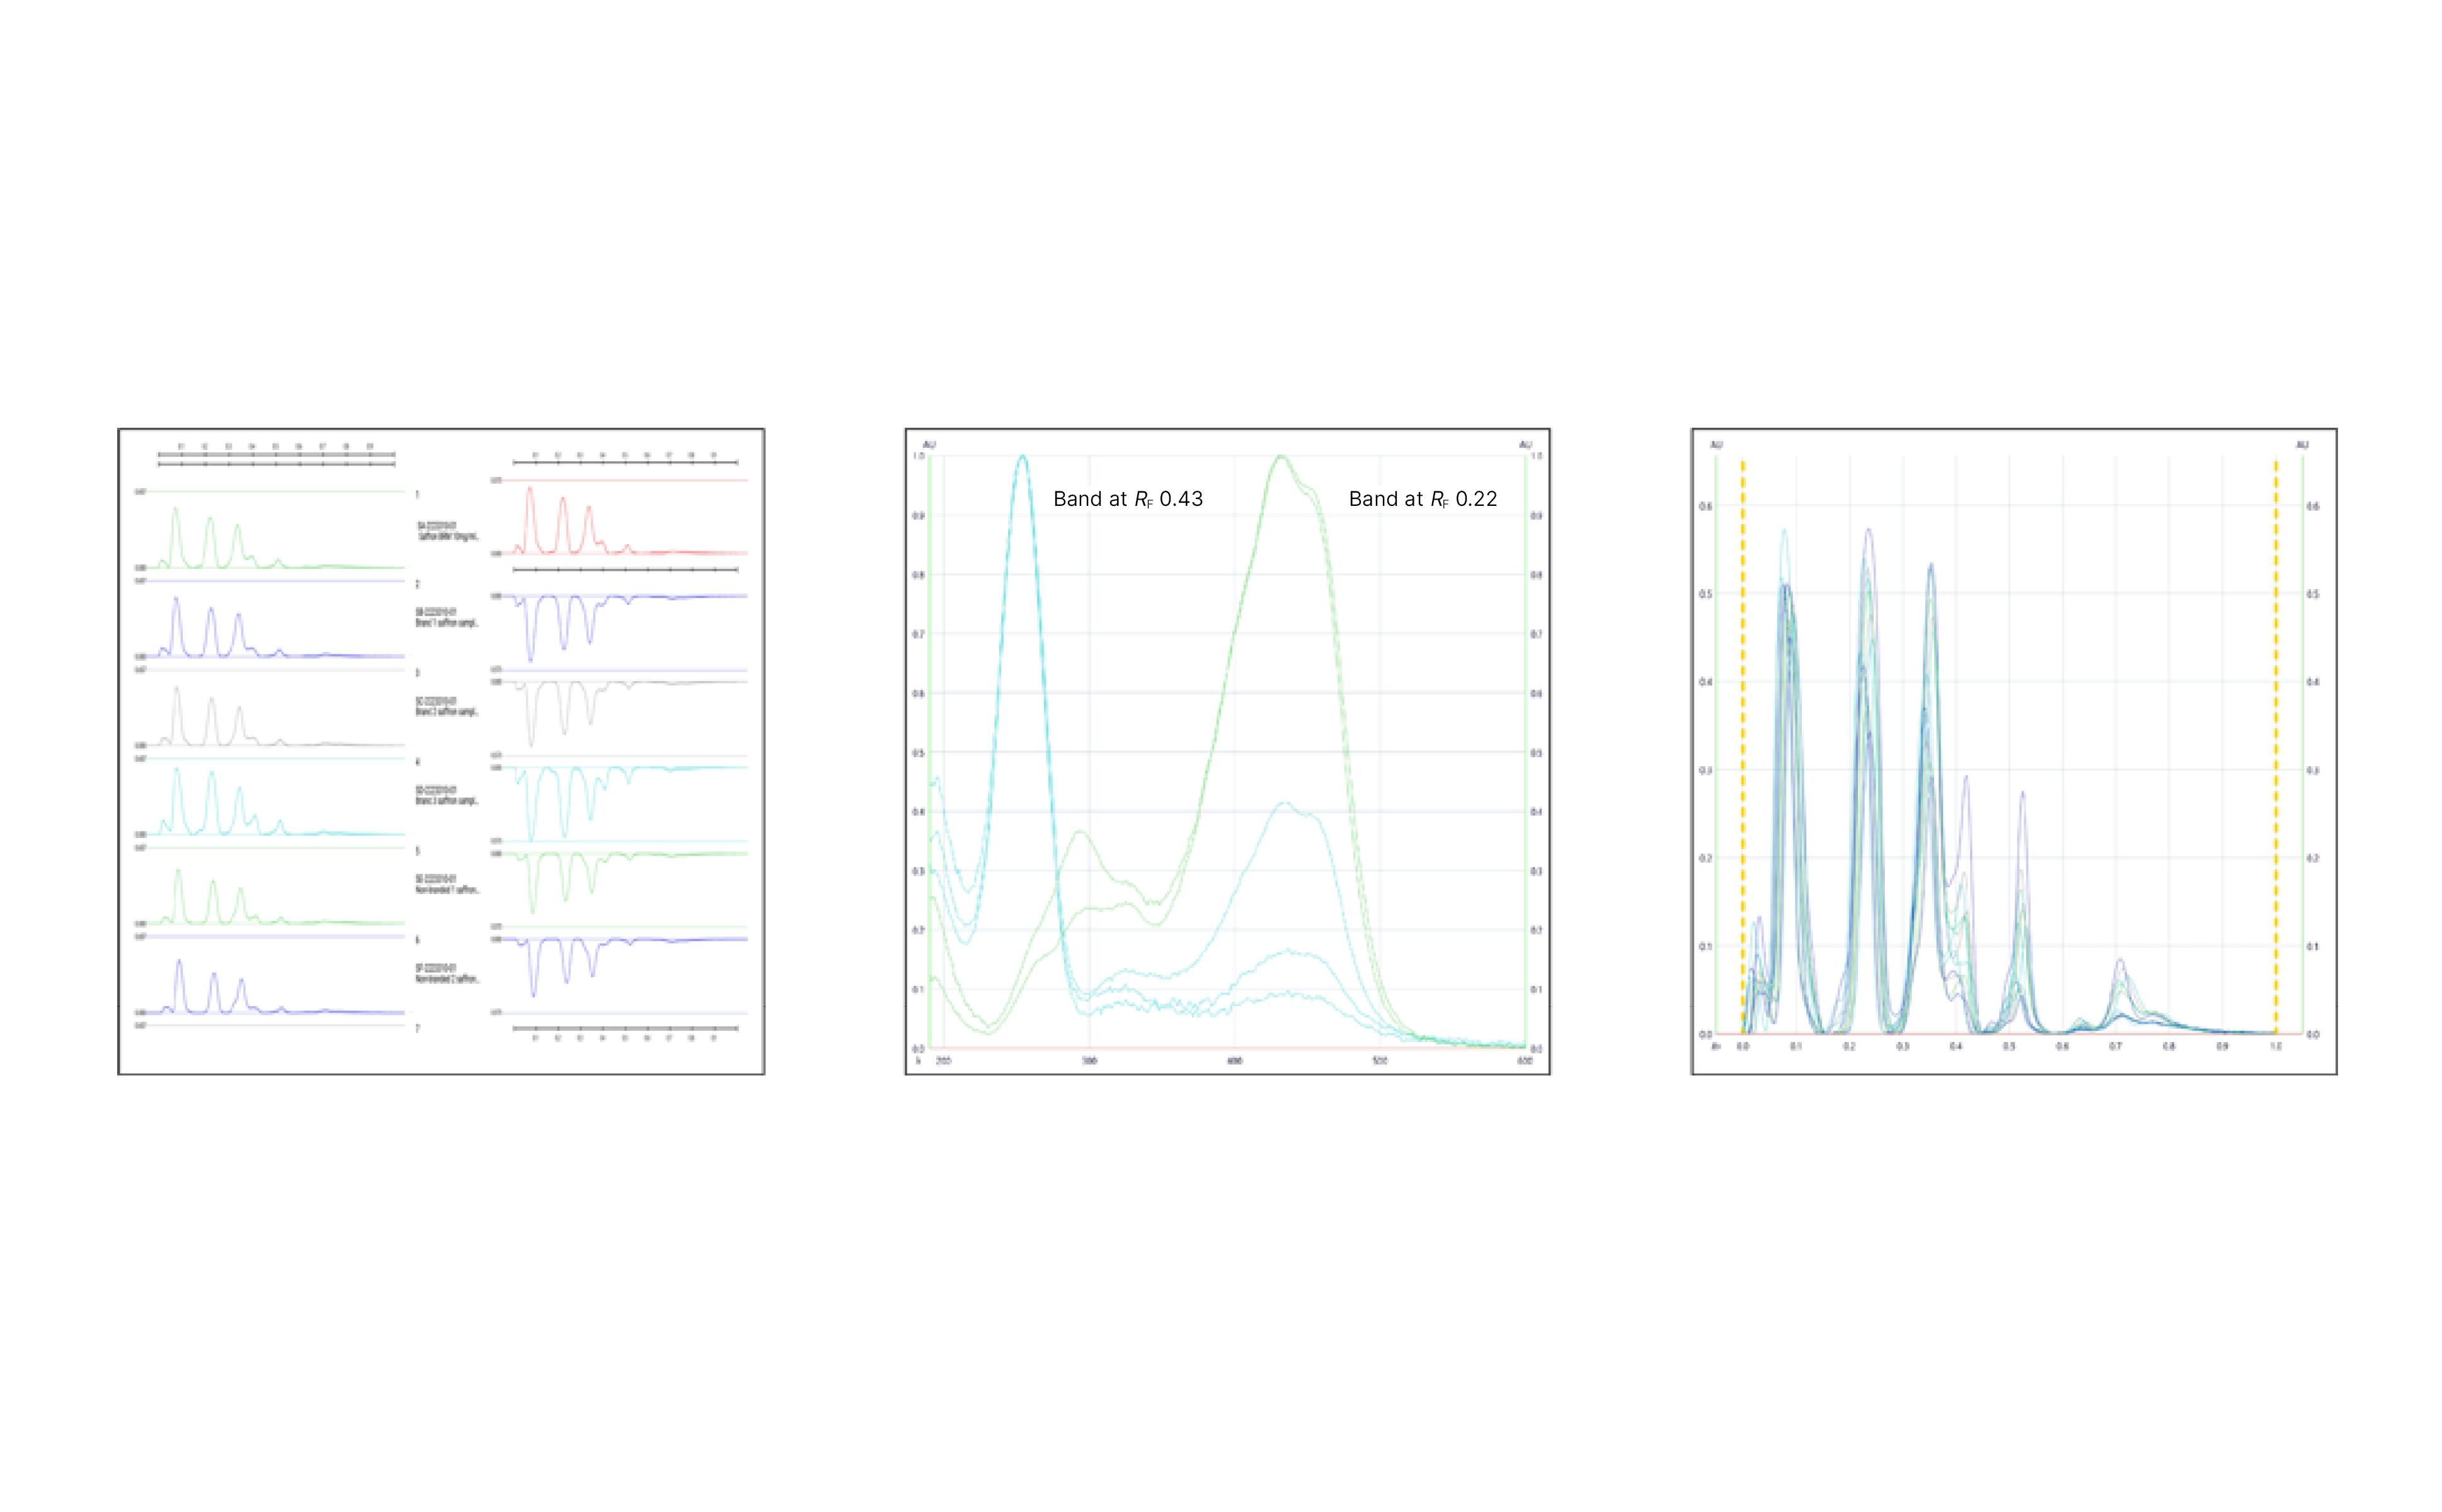
In this investigation, we developed an HPTLC method that effectively resolved the complexity of the substances present in Cassia leaves and flowers. The separation revealed two distinct functional groups – flavonoids and anthraquinones – each exhibiting characteristic coloration.
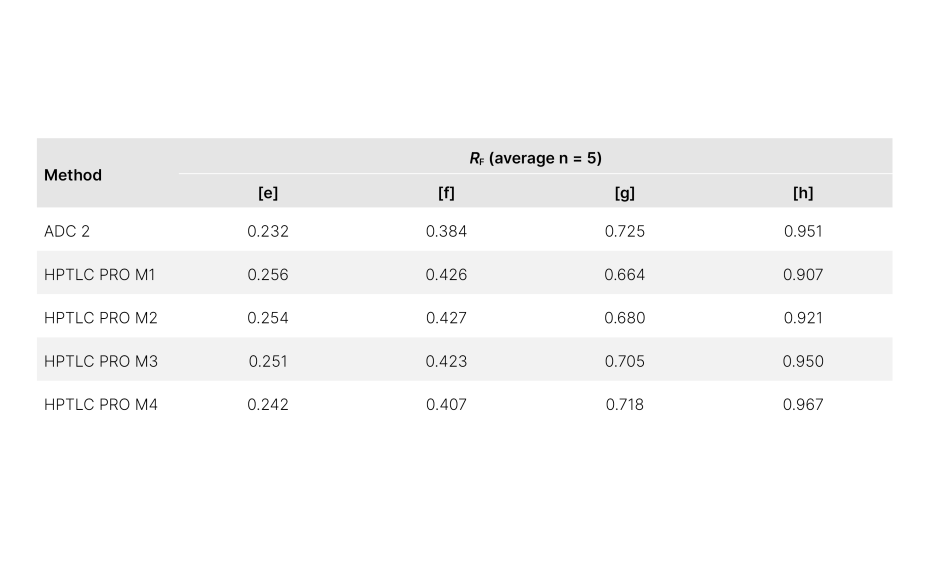
The RF values for each analyte were as follows:
luteolin-7-O-glucoside (RF 0.12), 3’,4’,7- trihydroxyflavone (RF 0.28), 4,7 dihydroxyflavone (RF 0.36), luteolin (RF 0.38), apigenin (RF 0.44), kaempferol (RF 0.46), biochanin A (RF 0.61), rhein (RF 0.55), obtusifolin (RF 0.69), emodin (RF 0.67), chrysophanol (RF 0.79), and physcion (RF 0.77).
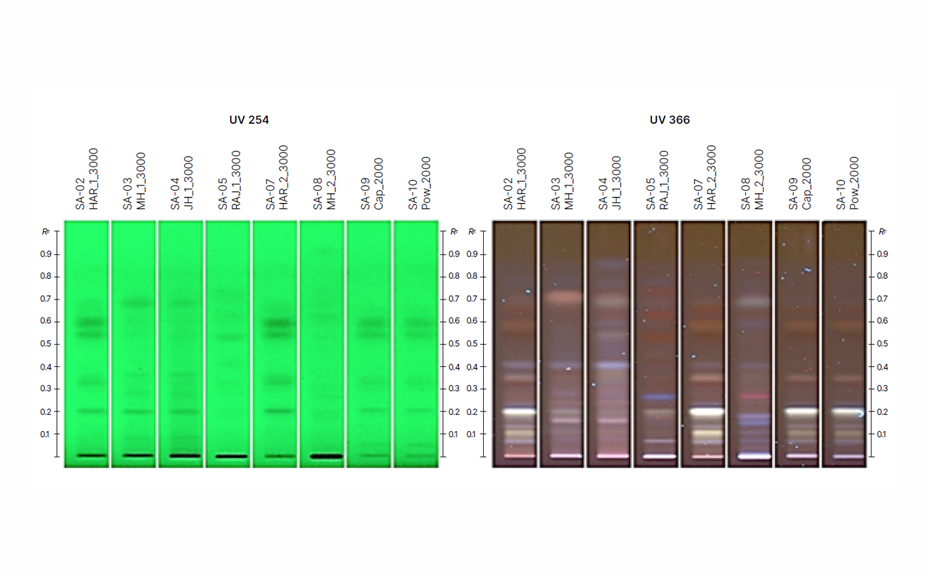
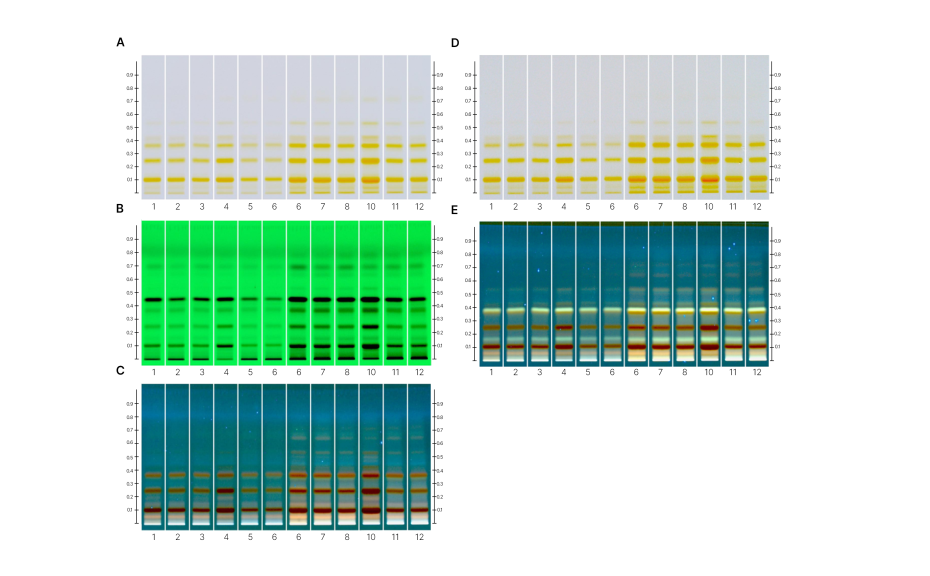
Detection was performed at UV 366 nm after development due to the fluorescence of the compounds, as the fluorescence quenching bands of most flavonoids are not visible under a 254 nm wavelength. After derivatization, the analytes appeared as brighter zones with different colors depending on their chemical structures.
The developed HPTLC method enabled the simultaneous qualitative identification of targeted analytes in multiple Cassia samples. This study illustrates that generating contrasting chemical fingerprints facilitates taxonomic
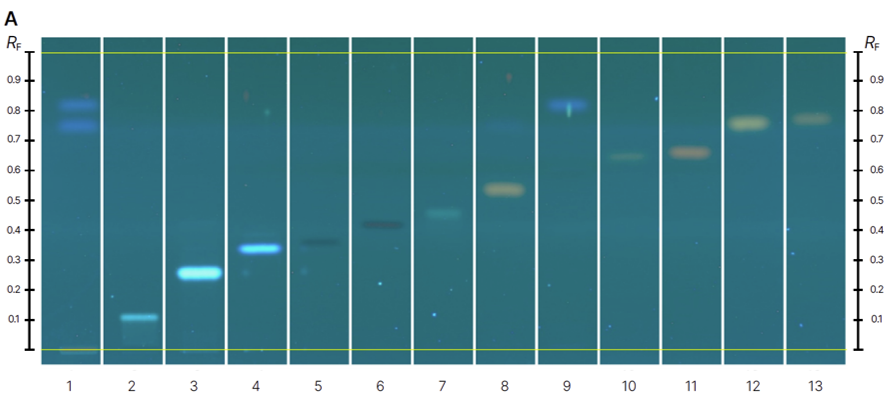
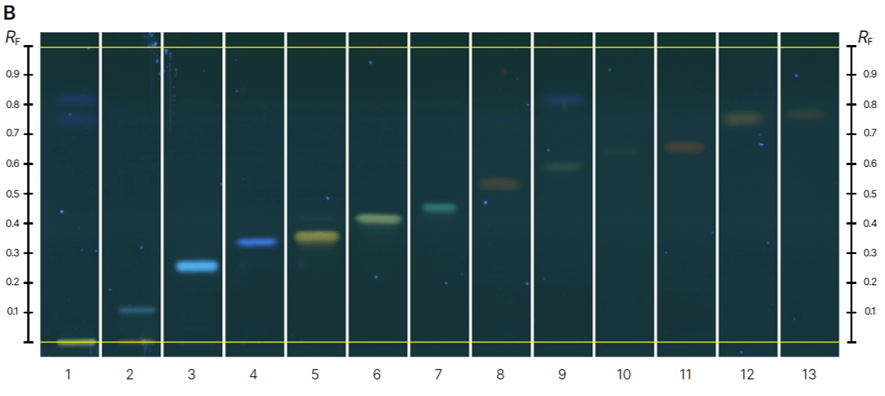
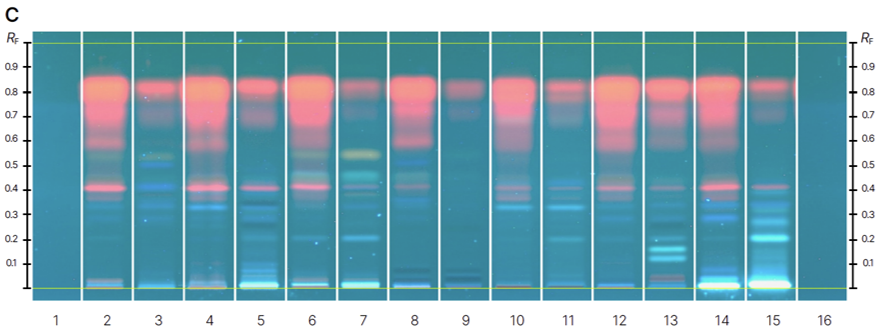
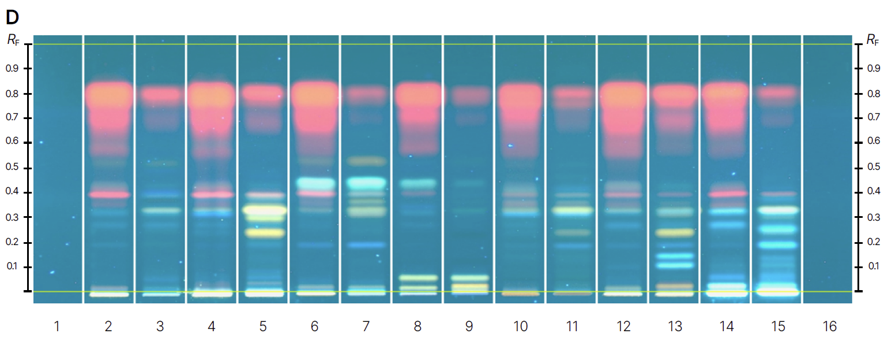
Chromatograms of reference standards (track 1-13) before derivatization at 366 nm (A) and after derivatization with NP-PEG reagent at 366 nm (B) and samples (track 1-16) before derivatization at 366 nm (C) and after derivatization with NP-PEG reagent at 366 nm (D).
Literature
[1] Lodha S.R. et al. J Adv Pharm Technol Res 1(3), (2010) 330–333.
[2] Verma L. et al. (2010) Indian J Pharmacol 42(4), (2010) 224–228.
[3] Girme A, Saste G, Kureshi AA, Jagtap S, Kamble S, Wadye SD, Hingorani L. Integrated Multiplatform Analysis and Separation of Thirteen Flavonoids and Anthraquinones in Seven Medicinal Cassia Species. J AOAC Int. 2024 Jul 4;107(4):714-726. doi: 10.1093/jaoacint/qsae028. PMID: 38648754
Contact: Ganesh Saste, Analytical Development and Innovation Center, Pharmanza Herbal Pvt. Ltd., Plot # 214, Borsad-Tarapur Road, Nr. Vadadla Patiya, At and PO: Kaniya-388430, Ta: Petlad, Dist: Anand (Gujarat) India, ard@pharmanzaherbals.com