

St. John’s wort (Hypericum perforatum) products
Abstract
Background
St John’s wort products (Hypericum perforatum L.) are widely available for sale in many countries including the UK via the internet. In the UK, these products are required to hold either a marketing authorisation or Traditional herbal registration (THR) to be sold legally. The THR and other regulatory schemes help to ensure product safety and quality providing an example of best practice but there is a risk if both regulated and un-regulated products continue to be available to consumers.
Aims
The project is embedded in a larger study aiming to investigate the quality of different herbal medicinal products along diverse value chains. Here we focus on a comparison of the quality of the finished products and assess phytochemical variation between registered products (THRs) and products obtained from the market without any registration.
Methods
47 commercial products (granulated powders and extracts) were sourced from different suppliers. We analysed these samples using high performance thin layer chromatography (HPTLC) and 1H NMR spectroscopy coupled with multi-variate analysis software following a method previously developed by our group.
Results
The consistency of the products varies significantly. Adulteration of the products (36%), possibly with other Hypericum species obtained from China or use of chemically distinct H. perforatum cultivars or chemotypes, and adulteration of the products (19%) with food dyes (tartrazine, amaranth, brilliant blue, sunset yellow) were the principle findings of this study.
Conclusions
There is significant compositional variation among commercial finished products and two main causative quality problems were identified as adulteration by incorrect species or adulteration with food dyes. Generally, food supplements and unlicensed products were found to be of poorer quality than the regulated ones including THRs.
https://www.sciencedirect.com/science/article/pii/S094471131730185X
mentioned products
The following products were used in this case study

HPTLC fingerprint profile analysis of cocoa proanthocyanidins depending on origin and genotype
Abstract
Cocoa beans are rich in bioactive phytochemicals such as alkaloids, anthocyanins, as well as monomeric and oligomeric flavan-3-ols. A high performance thin layer chromatography (HPTLC) method was developed for a fast analysis of a fingerprint of bioactive compounds present in cocoa beans depending on genotype and origin. Evaluation was performed using HPTLC followed by densitometry. The best separation for a fingerprint consisting of eight phenolic compounds as markers was achieved on silica gel 60 F254 HPTLC plates with a solvent mixture of ethyl formate, formic acid, water, toluene 30/4/3/1.5 (v/v/v/v). Staining with Fast Blue Salt B enabled visualization and quantitative evaluation. Compounds of interest were confirmed by eluting zones using a TLC-MS interface. LODs were ≤ 100 ng/zone for all compounds. The fingerprints obtained are useful for quality control of cocoa beans allowing their differentiation according to cocoa or chocolate sorts, varieties, and origins.
https://www.sciencedirect.com/science/article/pii/S0308814617314450
mentioned products
The following products were used in this case study

TLC and HPTLC-MS in the manufacturing of clinical API batches
Amélie Havard and Daniel Dron work in the R&D department Analytical Innovative Technologies at the Industrial Research Centre at Oril Industrie, in Bolbec, France. The R&D team specializes in purification processes of intermediates and active pharmaceutical ingredients (APIs) for toxicological, galenical or clinical studies. Part of their work is also the isolation of impurities and production of APIs or impurity reference batches. In 2018, the team launched their preparative chromatography service InnoPrepTM, dedicated to small- and large-scaled purifications. APIs, intermediates and impurities are characterized by MS and NMR. A quantitative 1D and 2D NMR method is currently being developed.
Introduction
Efficient purifications by a selective preparative chromatography are widely used in the manufacturing of API batches. The described procedure helps in the understanding of target molecules and related impurities. Impurities, present at very low levels can be isolated at a high purity, which eases identification and finally improves the process. By providing higher purity products in less time, significant financial gain can be achieved.
The required conditions for an efficient purification (ca. 75% use silica gel at Oril Industrie) are determined by TLC. Then, the purification progress is checked by preparative column chromatography via HPTLC. Twenty fractions were analyzable within 1 hour. TLC/HPTLC is the method of choice due to its simplicity, rapidness and the successful scale up from TLC to preparative separations. HPTLC-MS helped to quickly resolve the composition of a mixture.
Sample preparation
Crude product (0.05 g) dissolved in 5 mL ethyl acetate
Chromatogram layer
TLC plate silica gel 60 F254 (Merck), 20 x 5 cm HPTLC plate silica gel 60 F254s (Merck), 20 x 10 cm
Sample application
Automatic TLC Sampler (ATS 4), bandwise application, up to 20 tracks, band length 8.0 mm, sample volumes of 1–15 μL
Chromatography
In the Twin Trough Chamber 20 x 20 cm (TLC) or 20 x 10 cm (HPTLC) with chamber saturation (with filter paper) for 20 min with different solvents to the migration distance of 100 mm for TLC and 50 mm for HPTLC (both from the lower edge), drying in a stream of cold air for 5 min
Documentation
TLC Visualizer at UV 254 nm
Mass spectrometry
Elution of zones with the TLC-MS Interface (oval elution head) at a flow rate of 0.2 mL/min with methanol – water 1:1 into a Q-TOF-MS (Xevo® G2- XS QTof, Waters), operating in the positive ionization mode (m/z 50–1200)
NMR
Elution of zones with the TLC-MS Interface (oval elution head) at a flow rate of 0.2 mL/min with methanol into a vial, followed by evaporation to dryness, dissolution of the residue in deuterated chloroform (with one drop of sodium deuteroxide solution) and 1H NMR recording (400 MHz, Bruker)
Results and discussion
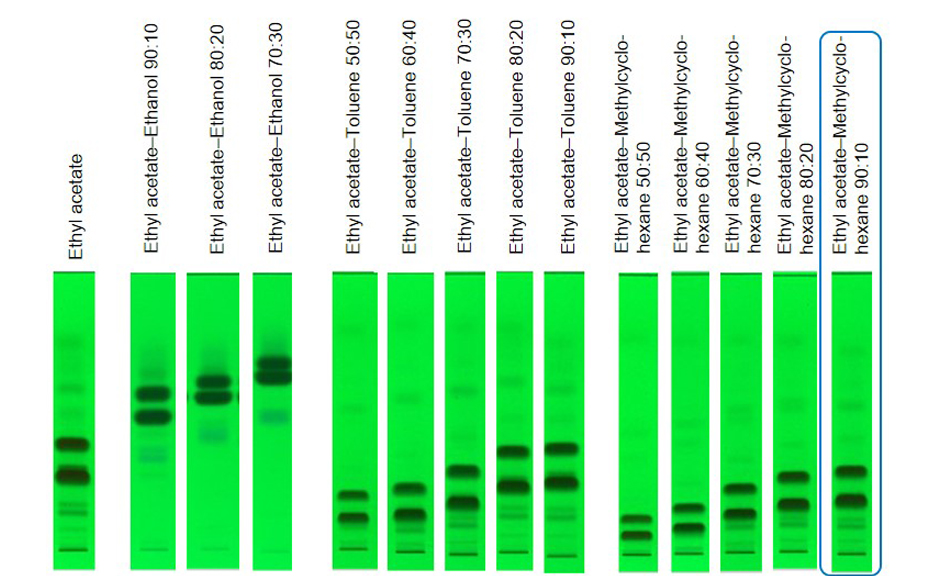
The aim of this study was to obtain a batch with a purity >99% of the isomer Z, containing <1% of isomer E and < 0.15% of other impurities. By RP-HPLC the isomers were not separated satisfyingly, and TLC was selected for method development to separate the two isomers. Ethyl acetate – methylcyclohexane 9:1 was the best option to separate all compounds at reasonable hRF values allowing a fast purification.
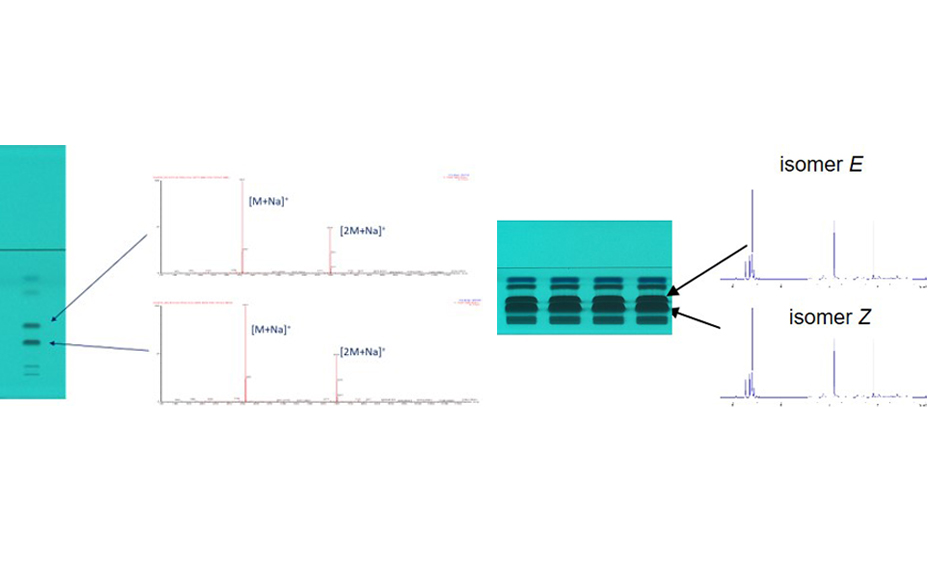
Mass spectra were recorded to characterize the different compounds. The same sodium adduct [M+Na]+ and respective dimer [2M+Na]+ were obtained for both Z/E isomeres. For NMR, the crude product solution was concentrated by a factor of 10, applied (15 μL) on the HPTLC plate, separated, and four zones of each target zone were eluted and combined.
The purification of the crude product (2 kg dissolved in toluene) on a 45-cm column (packed at 40 bars with 40 kg silica gel 60, 15–40 μm, Merck) at a flow rate of 10 L/min with ethyl acetate – methylcyclohexane 9:1 led to a productivity of 20 kg per day. The elution process was monitored online by UV 254 nm detection and in parallel offline by HPTLC.
The different fractions of the target isomer Z were collected and the combined fractions analyzed by NMR. The purity was not sufficient, as the NMR spectrum showed several impurities. Thus, the purification was optimized. The new eluent of dichloromethane – ethanol 19:1 together with a crude product load of 0.5 kg also led to a productivity of 20 kg per day. The purity obtained for the Z isomer was 99.8% with a yield of 88%.
TLC is the best method for development and optimization of purification processes using silica gel. It is simple and allows a rapid upscaling to preparative columns. HPTLC is an efficient tool for offline monitoring of the eluted fractions. Up to 20 fractions can be analyzed in parallel and compared in the HPTLC chromatogram at UV 254 nm, achieving a good overview on the purity and amount of the target compound per fraction.
-
01
TLC chromatograms at UV 254 nm of the crude product separated with different mobile phases
-
02
HPTLC chromatograms at UV 254 nm of the crude product (10 g/L, 1 μL versus 100 g/L,15 μL) and mass spectra (left) versus 1H NMR spectra of isomeres (right)
-
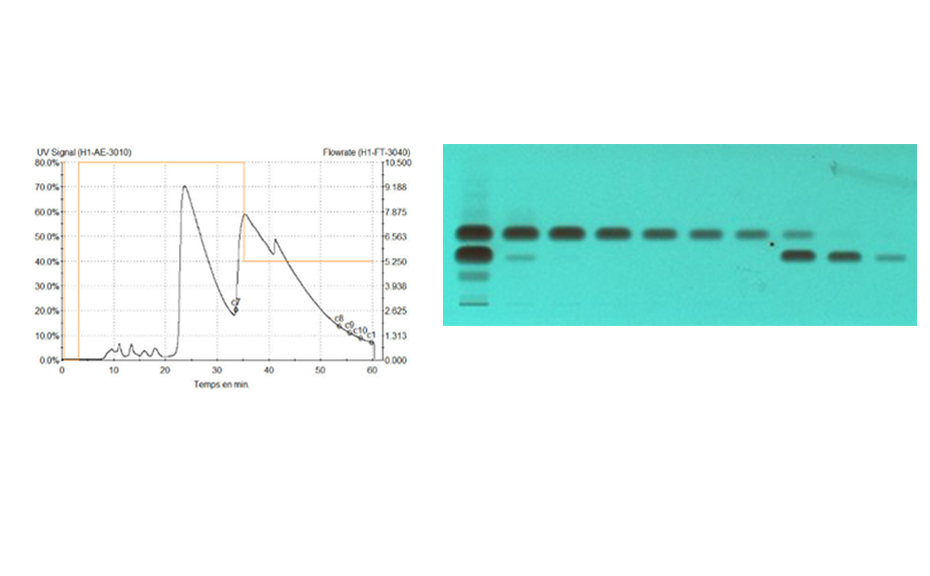
03
Online monitoring of the purification process by LC-UV (254 nm, left) versus offline by HPTLC-UV (individual fractions at 254 nm, right)
Further information on request from the authors.
Contact: Amélie Havard, Daniel Dron, Oril Industrie (Servier), Industrial Research Centre, Department of Analytical Innovative Technologies R&D, 13 rue Auguste Desgenétais, CS 60125, 76210 Bolbec, France amelie.havard@servier.com, daniel.dron@servier.com
mentioned products
The following products were used in this case study

The authenticity and quality of Rhodiola rosea products
ABSTRACT
Background
Rhodiola rosea L. Crassulaceae, root (Golden Root, Arctic Root) is a high-value herbal medicinal product, registered in the UK for the treatment of stress-induced fatigue, exhaustion and anxiety based on traditional use and used throughout Europe as a herbal medicinal product for similar indications. Numerous unregistered supplements are also available. There are several Chinese species used in traditional Chinese medicine (TCM), including Rhodiola crenulata (Hook.f. & Thomoson) that is believed to be a common adulterant in the R. rosea value chain.
Aims
The project is embedded in a larger study aiming to investigate the diverse value chains that lead to the production of R. rosea as an herbal medicinal product or supplement. Here we focus on a comparison of the quality of the finished products and assess any phytochemical variation between products registered under the Traditional Herbal Medicine Products Directive (THMPD) and products obtained from the market without any registration (i.e. generally unlicensed supplements). Our key aim is to establish the extent of the problem in terms of adulteration of consumer products claiming to contain R. rosea(or R. crenulata).
Methods
Approximately 40 commercial products (granulated powders and extracts) were sourced from different suppliers. We analysed these samples using high performance thin layer chromatography (HPTLC), mass spectrometry (MS) and (1)H NMR spectroscopy coupled with multi-variate analysis software following a method previously developed by our group for the analysis of turmeric products.
Results
We investigate the phytochemistry of the different species and assess the potential of R. crenulata as an adulterant at the end of the R. rosea value chains. The consistency of the products varies significantly. Approximately one fifth of commercial products that claimed to be R. rosea did not contain rosavin (the key reference markers used to distinguish R. rosea from related species). Moreover some products appeared not to contain salidroside, another marker compound found in other Rhodiola species. Approximately 80% of the remaining commercial products were lower in rosavin content than the registered products and appeared to be adulterated with other Rhodiola species.
Conclusions
The variation in phytochemical constituents present in Rhodiola products available to European buyers via the internet and other sources is a major cause for concern. Adulteration with different species, and other sometimes unknown adulterants, appears to be commonplace. Good quality systems and manufacturing practices, including those required under the THMPD, enable consumers to have confidence that products are authentic and meet a high specification for quality and safety.
https://www.ncbi.nlm.nih.gov/pubmed/26626192
mentioned products
The following products were used in this case study

Chemical Characterization of Salvia Species
Abstract
In Valencia Region (Spain), some wild and cultivated sages are used for medicinal purposes. Among them, Salvia officinalis subsp. lavandulifolia (SL) is widely employed and known for production of Spanish sage oil and herbal products. Nevertheless, it shares the market with S. blancoana subsp. mariolensis (SB) and, to a lesser extent, with their hybrid S. x hegelmaieri (SH). The knowledge on these two species is far low and confusion between them is possible. The aim of the present paper is to improve the ethnopharmacological, morphological and chemical knowledge of these sages, and to contribute to setting up quality specifications for improving identification and distinction from other Salvia species, such as, S. officinalis subsp. officinalis, S. x auriculata and S. microphylla var. microphylla. Samples were collected in Valencia Region and surrounding mountain areas during the ethnopharmacological field work. Twenty-nine medicinal uses were reported for SL, 13 of them being also recorded for SB. Of particular interest is a homemade liquor, used as digestive and known as “salvieta,” which is mainly prepared with SB. The macro- and microscopic characters are insufficient for identification of cut, crushed or powdered material. The study of the essential oil and a HPTLC (High Performance Thin Layer Chromatography) fingerprint of their extracts could help to distinguish SB from the other sages. The essential oil from dried aerial parts of SB (content: 1.8–4.5%) was characterized by GC-FID (Gas Chromatography with Flame Ionization Detector) and GC-MS (Gas Chromatography coupled to Mass Spectrometry) showing a composition close to that currently accepted for Spanish sage essential oil in the European Pharmacopoeia, ISO (International Standard Organization) and UNE (Una Norma Española) standards, with 1,8-cineole (13.7–45.7%) and camphor (12.1–28.6%) as major constituents. HPTLC methods, based on the analysis of hydroalcoholic and dichloromethane extracts, allowed to distinguish SB from other Salvia taxa currently found in Valencia region, except from its hybrid SH. This interdisciplinary study, that combines popular knowledge with botany and chemistry, allows to identify the raw herbal material from SB and to distinguish it from other Salvia species, ensuring a proper commercialization as herbal teas or for the preparation of spirits.
mentioned products
The following products were used in this case study